Getting Started with WinUI Cartesian Chart (SfCartesianChart)
10 Jul 202617 minutes to read
This section explains how to populate the Cartesian chart with data, a header, data labels, a legend and tooltips, as well as the essential aspects for getting started with the chart.
Creating an application with WinUI Chart
- Create a WinUI 3 desktop app for C# and .NET 5.
- Add reference to Syncfusion.Chart.WinUI NuGet.
- To initialize the control, import the control namespace
Syncfusion.UI.Xaml.Chartsin XAML or C#. -
Initialize SfCartesianChart control.
<Window

    <!-- Configure additional chart elements -->
    xmlns:chart="using:Syncfusion.UI.Xaml.Charts">

    <Grid x:Name="grid">
        <chart:SfCartesianChart/>
    </Grid>
</Window>
using Syncfusion.UI.Xaml.Charts; namespace SfChart_GettingStarted { public sealed partial class MainWindow : Window { public MainWindow() { InitializeComponent(); SfCartesianChart chart = new SfCartesianChart(); grid.Children.Add(chart); } } }
Initialize View Model
Define a simple data model that represents a data point in chart.
public class Person
{
    public string Name { get; set; }
    public double Height { get; set; }
}
Next, create a view model class and initialize a list of Person objects as follows.
public class ViewModel
{
    public List<Person> Data { get; set; }
    public ViewModel()
    {
        Data = new List<Person>()
        {
            new Person { Name = "David", Height = 170 },
            new Person { Name = "Michael", Height = 96 },
            new Person { Name = "Steve", Height = 65 },
            new Person { Name = "Joel", Height = 182 },
            new Person { Name = "Bob", Height = 134 }
        };
    }
}
Set the ViewModel instance as the DataContext of the chart to bind its properties.
NOTE
Add namespace of
ViewModelclass to your XAML Page if you prefer to setDataContextin XAML.
<Window
    x:Class="SfChart_GettingStarted.MainWindow"
    xmlns="http://schemas.microsoft.com/winfx/2006/xaml/presentation"
    xmlns:x="http://schemas.microsoft.com/winfx/2006/xaml"
    xmlns:model="using:SfChart_GettingStarted"
    xmlns:d="http://schemas.microsoft.com/expression/blend/2008"
    xmlns:chart="using:Syncfusion.UI.Xaml.Charts"
    xmlns:mc="http://schemas.openxmlformats.org/markup-compatibility/2006"
    mc:Ignorable="d" Height="350" Width="525"
    Background="{ThemeResource ApplicationPageBackgroundThemeBrush}">

    <Grid x:Name="grid">
	    <Grid.DataContext>
	        <model:ViewModel/>
	    </Grid.DataContext>
    </Grid>
</Window>grid.DataContext = new ViewModel();Initialize Chart Axis
ChartAxis is used to locate the data points inside the chart area. The XAxes and YAxes collection of the chart is used to initialize the axis for the chart.
<chart:SfCartesianChart>
    <chart:SfCartesianChart.XAxes>
        <chart:CategoryAxis/>
    </chart:SfCartesianChart.XAxes>

    <chart:SfCartesianChart.YAxes>
        <chart:NumericalAxis/>
    </chart:SfCartesianChart.YAxes>
</chart:SfCartesianChart>
SfCartesianChart chart = new SfCartesianChart();
CategoryAxis xAxis = new CategoryAxis();
chart.XAxes.Add(xAxis);
NumericalAxis yAxis = new NumericalAxis();
chart.YAxes.Add(yAxis);Run the project and check if you get the following output to make sure you have configured your project properly to add chart.
Populate Chart with Data
As we are going to visualize the comparison of heights in the data model, add ColumnSeries to Series property of chart, and then bind the Data property of the above ViewModel to the ColumnSeries.ItemsSource as follows.
NOTE
You need to set XBindingPath and YBindingPath properties, so that the chart will fetch values from the respective properties in the data model to plot the series.
<chart:SfCartesianChart>
    <chart:SfCartesianChart.XAxes>
        <chart:CategoryAxis Header="Name"/>
    </chart:SfCartesianChart.XAxes>

    <chart:SfCartesianChart.YAxes>
        <chart:NumericalAxis Header="Height(in cm)"/>
    </chart:SfCartesianChart.YAxes>

    <chart:ColumnSeries
        ItemsSource="{Binding Data}"
        XBindingPath="Name"
        YBindingPath="Height">
    </chart:ColumnSeries>
</chart:SfCartesianChart>
SfCartesianChart chart = new SfCartesianChart();
//Adding horizontal axis to the chart
CategoryAxis xAxis = new CategoryAxis();
xAxis.Header = "Name";
chart.XAxes.Add(xAxis);
//Adding vertical axis to the chart
NumericalAxis yAxis = new NumericalAxis();
yAxis.Header = "Height(in cm)";
chart.YAxes.Add(yAxis);
//Initialize the series for SfChart
ColumnSeries series = new ColumnSeries();
series.ItemsSource = (new ViewModel()).Data;
series.XBindingPath = "Name";
series.YBindingPath = "Height";
//Adding Series to the Chart Series Collection
chart.Series.Add(series);Add Title
The title of the chart provides quick information to the user about the data being plotted in the chart. The Header property is used to set title for the chart as follows.
<Grid>
   <chart:SfCartesianChart Header="Height Comparison">
   </chart:SfCartesianChart>
</Grid>
SfCartesianChart chart = new SfCartesianChart();
chart.Header = "Height Comparison";Enable Data Labels
The ShowDataLabels property of series can be used to enable the data labels to improve the readability of the chart. The label visibility is set to False by default.
<chart:SfCartesianChart>

    <!-- Configure additional chart elements -->
    <chart:ColumnSeries ShowDataLabels="True">
    </chart:ColumnSeries>

</chart:SfCartesianChart>
SfCartesianChart chart = new SfCartesianChart();
// Configure additional chart elements
ColumnSeries series = new ColumnSeries();
series.ShowDataLabels = true;
chart.Series.Add(series);Enable Legend
The legend provides information about the data point displayed in the chart. The Legend property of the chart was used to enable it.
<chart:SfCartesianChart>

    <!-- Configure additional chart elements -->
    <chart:SfCartesianChart.Legend>
        <chart:ChartLegend/>
    </chart:SfCartesianChart.Legend>

</chart:SfCartesianChart>
SfCartesianChart chart = new SfCartesianChart();
chart.Legend = new ChartLegend();NOTE
Additionally, set a label for each series using the Label property of chart series, which will be displayed in corresponding legend.
<chart:SfCartesianChart>

    <!-- Configure additional chart elements -->
    <chart:ColumnSeries
        Label="Heights"
        ItemsSource="{Binding Data}"
        XBindingPath="Name"
        YBindingPath="Height">
    </chart:ColumnSeries>

</chart:SfCartesianChart>
ColumnSeries series = new ColumnSeries();
series.ItemsSource = (new ViewModel()).Data;
series.XBindingPath = "Name";
series.YBindingPath = "Height";
series.Label = "Heights";Enable Tooltip
Tooltips are used to show information about the segment, when the user hovers over the segment. Enable tooltip by setting the series EnableTooltip property to true.
<chart:SfCartesianChart>

    <!-- Configure additional chart elements -->
    <chart:ColumnSeries
        EnableTooltip="True"
        ItemsSource="{Binding Data}"
        XBindingPath="Name"
        YBindingPath="Height"/>

</chart:SfCartesianChart>
ColumnSeries series = new ColumnSeries();
series.ItemsSource = (new ViewModel()).Data;
series.XBindingPath = "Name";
series.YBindingPath = "Height";
series.EnableTooltip = true;Full Example
The following code example gives you the complete code of above configurations.
<Window
x:Class="SfChart_GettingStarted.MainWindow"
xmlns="http://schemas.microsoft.com/winfx/2006/xaml/presentation"
xmlns:x="http://schemas.microsoft.com/winfx/2006/xaml"
xmlns:d="http://schemas.microsoft.com/expression/blend/2008"
xmlns:chart="using:Syncfusion.UI.Xaml.Charts"
xmlns:mc="http://schemas.openxmlformats.org/markup-compatibility/2006"
mc:Ignorable="d" Height="350" Width="525"
xmlns:model="using:SfChart_GettingStarted"
Background="{ThemeResource ApplicationPageBackgroundThemeBrush}">
<chart:SfCartesianChart Header="Height Comparison">
<chart:SfCartesianChart.Legend>
<chart:ChartLegend/>
</chart:SfCartesianChart.Legend>
<chart:SfCartesianChart.DataContext>
<model:ViewModel/>
</chart:SfCartesianChart.DataContext>
<!--Initialize the axis for chart-->
<chart:SfCartesianChart.XAxes>
<chart:CategoryAxis Header="Names"/>
</chart:SfCartesianChart.XAxes>
<chart:SfCartesianChart.YAxes>
<chart:NumericalAxis Header="Height(in cm)"/>
</chart:SfCartesianChart.YAxes>
<!--Initialize the series for chart-->
<chart:ColumnSeries
Label="Heights"
EnableTooltip="True"
ShowDataLabels="True"
ItemsSource="{Binding Data}"
XBindingPath="Name"
YBindingPath="Height">
<chart:ColumnSeries.DataLabelSettings>
<chart:CartesianDataLabelSettings Position="Inner"/>
</chart:ColumnSeries.DataLabelSettings>
</chart:ColumnSeries>
</chart:SfCartesianChart>
</Window>using CartesianChart_CS;
using Microsoft.UI.Xaml;
using Syncfusion.UI.Xaml.Charts;
namespace SfChart_GettingStarted
{
public sealed partial class MainWindow : Window
{
public MainWindow()
{
InitializeComponent();
SfCartesianChart chart = new SfCartesianChart()
{
Header = "Height Comparison",
Height = 300,
Width = 500
};
//Adding horizontal axis to the chart
CategoryAxis xAxis = new CategoryAxis();
xAxis.Header = "Name";
xAxis.FontSize = 14;
chart.XAxes.Add(xAxis);
//Adding vertical axis to the chart
NumericalAxis yAxis = new NumericalAxis();
yAxis.Header = "Height(in cm)";
yAxis.FontSize = 14;
chart.YAxes.Add(yAxis);
//Adding legend for the chart
ChartLegend legend = new ChartLegend();
chart.Legend = legend;
//Initializing column series
ColumnSeries series = new ColumnSeries();
series.ItemsSource = (new ViewModel()).Data;
series.XBindingPath = "Name";
series.YBindingPath = "Height";
series.EnableTooltip = true;
series.Label = "Heights";
series.ShowDataLabels = true;
series.DataLabelSettings = new CartesianDataLabelSettings()
{
Position = DataLabelPosition.Inner,
};
//Adding series to the chart series collection
chart.Series.Add(series);
this.Content = chart;
}
}
}The following chart is created as a result of the previous codes.
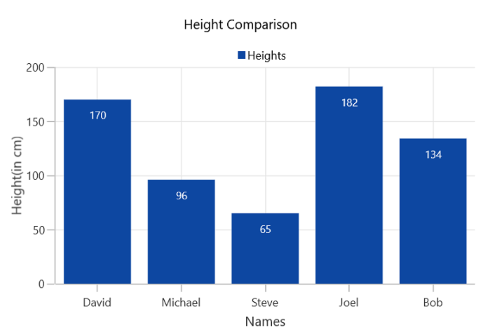
NOTE
Download demo application from GitHub. Looking for the full WinUI Charts component overview, features, pricing, and documentation? Visit the WinUI Charts page.
See Also