Trackball in WinUI Chart (SfCartesianChart)
10 Jul 202617 minutes to read
The trackball allows you to track a data point closer to the cursor position. The x values are determined from the position of the vertical line in the axis, and the y values are determined from the points touching the vertical line in the series.
Define Trackball
To add the trackball in the chart, create an instance of ChartTrackballBehavior and set it to the TrackballBehavior property of the chart.
<chart:SfCartesianChart>
    <chart:SfCartesianChart.TrackballBehavior>
        <chart:ChartTrackballBehavior/>
    </chart:SfCartesianChart.TrackballBehavior>

    <!-- Configure additional chart elements -->
</chart:SfCartesianChart>
SfCartesianChart chart = new SfCartesianChart();
// Configure additional chart elements
ChartTrackballBehavior behavior = new ChartTrackballBehavior();
chart.TrackballBehavior = behavior;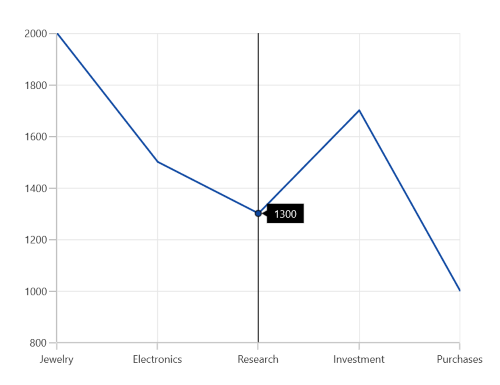
To view the trackball label in the particular axis, you have to enable the ShowTrackballLabel property in that axis as in the following code snippet.
<chart:SfCartesianChart>
    <chart:SfCartesianChart.XAxes>
        <chart:CategoryAxis ShowTrackballLabel="True"/>
    </chart:SfCartesianChart.XAxes>

    <!-- Configure additional chart elements -->
    <chart:SfCartesianChart.TrackballBehavior>
        <chart:ChartTrackballBehavior/>
    </chart:SfCartesianChart.TrackballBehavior>
</chart:SfCartesianChart>
SfCartesianChart chart = new SfCartesianChart();
ChartTrackballBehavior behavior = new ChartTrackballBehavior();
chart.TrackballBehavior = behavior;
CategoryAxis primaryAxis = new CategoryAxis()
{
ShowTrackballLabel = true
};
chart.XAxes.Add(primaryAxis);
// Configure additional chart elementsThe default appearance of the Trackball on the primary axis (CategoryAxis).
The Trackball is composed of the following parts:
- Line
- Symbol
- Axis label
- Series label
Trackball Line
The trackball line is visible when you initialize the ChartTrackballBehavior. If you want to collapse the visibility of the trackball line, then you have to set ShowLine to false.
<chart:SfCartesianChart>
    <chart:SfCartesianChart.TrackballBehavior>
        <chart:ChartTrackballBehavior ShowLine="False"/>
    </chart:SfCartesianChart.TrackballBehavior>
</chart:SfCartesianChart>
SfCartesianChart chart = new SfCartesianChart();
ChartTrackballBehavior behavior = new ChartTrackballBehavior()
{
ShowLine = false
};
chart.TrackballBehavior = behavior;
// Configure additional chart elements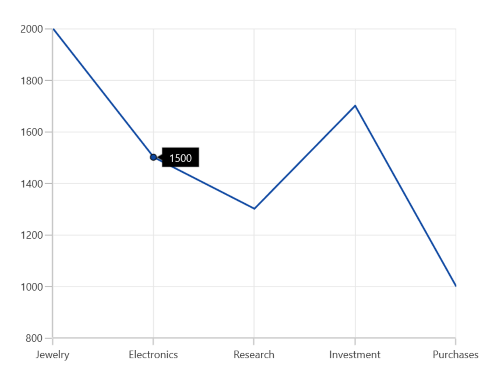
Customization of trackball line
By using the LineStyle property, you can customize the appearance of the trackball line.
<chart:SfCartesianChart Height="388"  Width="500">

    <!-- Configure additional chart elements -->
    <chart:SfCartesianChart.Resources>
        <Style TargetType="Line" x:Key="lineStyle">
            <Setter Property="StrokeDashArray" Value="5,2"/>
            <Setter Property="Stroke" Value="Red"/>
            <Setter Property="StrokeThickness" Value="2"/>
        </Style>
    </chart:SfCartesianChart.Resources>

    <chart:SfCartesianChart.TrackballBehavior>
        <chart:ChartTrackballBehavior LineStyle="{StaticResource lineStyle}"/>
    </chart:SfCartesianChart.TrackballBehavior>

</chart:SfCartesianChart>
SfCartesianChart chart = new SfCartesianChart();
// The 'lineStyle' resource is defined in XAML Resources and referenced here.
ChartTrackballBehavior Trackball = new ChartTrackballBehavior()
{
LineStyle = chart.Resources["lineStyle"] as Style
};
chart.TrackballBehavior = Trackball;
// Configure additional chart elements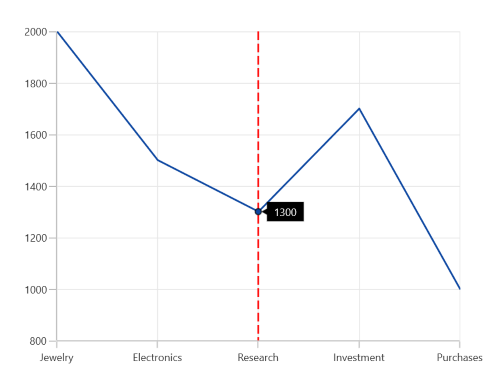
Symbol
By default, the trackball symbol is displayed as an ellipse. You can change the default style of the symbol by using the ChartTrackballStyle property.
<chart:SfCartesianChart Height="388"  Width="500">

    <!-- Configure additional chart elements -->
    <chart:SfCartesianChart.Resources>
        <Style TargetType="chart:ChartTrackballControl" x:Key="trackballStyle">
            <Setter Property="Background" Value="Red"></Setter>
        </Style>
    </chart:SfCartesianChart.Resources>
    <chart:SfCartesianChart.TrackballBehavior>
        <chart:ChartTrackballBehavior ChartTrackballStyle="{StaticResource trackballStyle}"/>
    </chart:SfCartesianChart.TrackballBehavior>

</chart:SfCartesianChart>
SfCartesianChart chart = new SfCartesianChart();
// The 'trackballStyle' resource is defined in XAML Resources and referenced here.
ChartTrackballBehavior Trackball = new ChartTrackballBehavior()
{
ChartTrackballStyle = chart.Resources["trackballStyle"] as Style
};
chart.TrackballBehavior = Trackball;
// Configure additional chart elements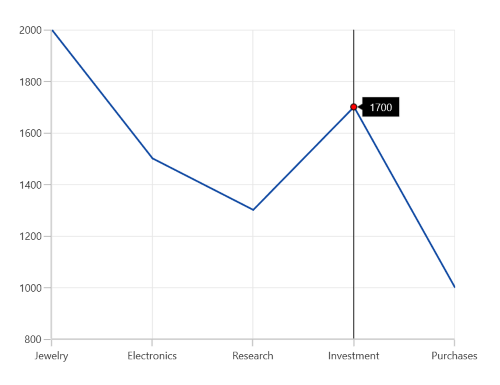
Axis Label
The axis label will be viewed when the ShowTrackballLabel property is set to true. The default value of ShowTrackballLabel is false.
<chart:SfCartesianChart>
    <chart:SfCartesianChart.XAxes>
        <chart:CategoryAxis ShowTrackballLabel="True"/>
    </chart:SfCartesianChart.XAxes>

    <!-- Configure additional chart elements -->
    <chart:SfCartesianChart.TrackballBehavior>
        <chart:ChartTrackballBehavior/>
    </chart:SfCartesianChart.TrackballBehavior>

</chart:SfCartesianChart>
SfCartesianChart chart = new SfCartesianChart();
// Configure additional chart elements
CategoryAxis primaryAxis = new CategoryAxis()
{
ShowTrackballLabel = true
};
chart.XAxes.Add(primaryAxis);
ChartTrackballBehavior behavior = new ChartTrackballBehavior();
chart.TrackballBehavior = behavior;
this.Content = chart;
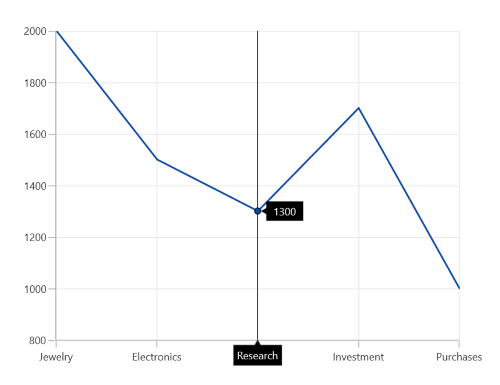
Axis label alignment
The alignment of the axis label can be defined using the AxisLabelAlignment property. By default, the axis label will be positioned in the center.
-
Auto- used to align in Near/Far positions based on the trackball movement. -
Far- used to align far from the position of the trackball. -
Near- used to align near to the position of the trackball. -
Center- used to align to the center of the trackball.
Customization of axis label
The appearance of the axis label can be customized by using the TrackballLabelTemplate property in the chart axis as shown in the below code snippet.
<chart:SfCartesianChart>
    <chart:SfCartesianChart.Resources>
        <DataTemplate x:Key="labelTemplate">
            <Border
                CornerRadius="4"
                BorderThickness="1"
                BorderBrush="Black"
                Background="LightGreen"
                Padding="6,0,6,6">
                <TextBlock
                    Foreground="Black"
                    Text="{Binding ValueX}"
                    FontSize="15"/>
            </Border>
        </DataTemplate>
    </chart:SfCartesianChart.Resources>

    <chart:SfCartesianChart.XAxes>
        <chart:CategoryAxis ShowTrackballLabel="True" TrackballLabelTemplate="{StaticResource labelTemplate}"/>
    </chart:SfCartesianChart.XAxes>

    <!-- Configure additional chart elements -->
</chart:SfCartesianChart>
SfCartesianChart chart = new SfCartesianChart();
// The 'labelTemplate' resource is defined in XAML Resources and referenced here.
NumericalAxis primaryAxis = new NumericalAxis()
{
ShowTrackballLabel = true,
TrackballLabelTemplate = chart.Resources["labelTemplate"] as DataTemplate
};
chart.XAxes.Add(primaryAxis);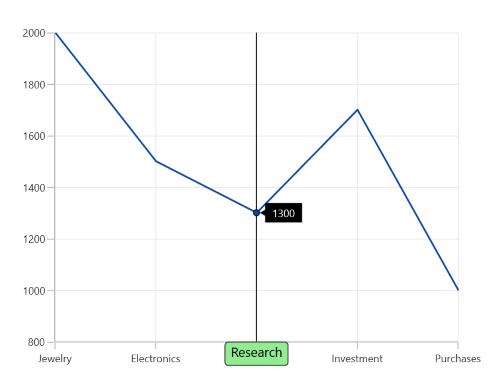
Series Label
When the mouse is hovered in the chart area, you can view the label displayed over the series in addition to the axis label.
ShowTrackballLabel
The ShowTrackballLabel property is used to enable or disable the label for the corresponding series. By default, the ShowTrackballLabel property is true.
<chart:SfCartesianChart>
    <chart:SfCartesianChart.Series>
        <chart:SplineSeries
            ItemsSource="{Binding Data}"
            XBindingPath="Demand"
            YBindingPath="Year2010"/>

        <chart:SplineSeries
            ItemsSource="{Binding Data}"
            XBindingPath="Demand"
            YBindingPath="Year2011"
            ShowTrackballLabel="False"/>

        <chart:SplineSeries
            ItemsSource="{Binding Data}"
            XBindingPath="Demand"
            YBindingPath="Year2012"/>
    </chart:SfCartesianChart.Series>

    <!-- Configure additional chart elements -->
</chart:SfCartesianChart>
SfCartesianChart chart = new SfCartesianChart();
// Configure additional chart elements
SplineSeries series1 = new SplineSeries();
chart.Series.Add(series1);
SplineSeries series2 = new SplineSeries()
{
ShowTrackballLabel = false
};
chart.Series.Add(series2);
SplineSeries series3 = new SplineSeries();
chart.Series.Add(series3);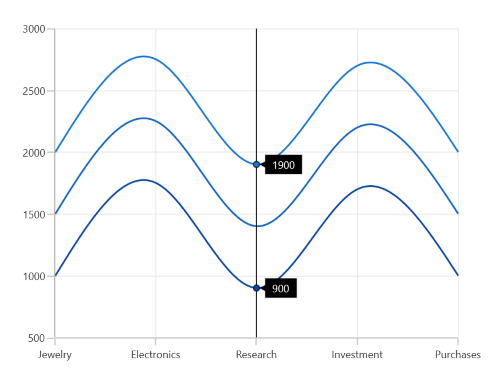
Alignment of series label
The trackball label displayed over the series can be aligned using the LabelHorizontalAlignment and LabelVerticalAlignment properties. By default, the LabelHorizontalAlignment is Left and LabelVerticalAlignment is Top.
<chart:SfCartesianChart>

    <!-- Configure additional chart elements -->
    <chart:SfCartesianChart.TrackballBehavior>
        <chart:ChartTrackballBehavior LabelHorizontalAlignment="Center" LabelVerticalAlignment="Center"/>
    </chart:SfCartesianChart.TrackballBehavior>

</chart:SfCartesianChart>
SfCartesianChart chart = new SfCartesianChart();
// Configure additional chart elements
ChartTrackballBehavior behavior = new ChartTrackballBehavior()
{
LabelHorizontalAlignment = ChartAlignment.Center,
LabelVerticalAlignment = ChartAlignment.Center
};
chart.TrackballBehavior = behavior;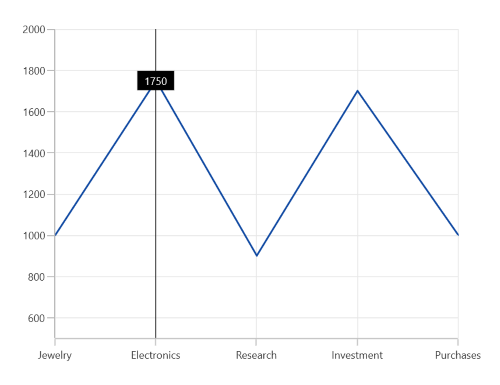
Display Mode
When there are multiple series, the trackball series label will be displayed only for the nearest point. If you want to display all the y values with respect to the x value, then the DisplayMode property should be set to FloatAllPoints.
FloatAllPoints
<chart:SfCartesianChart>
    <chart:SfCartesianChart.TrackballBehavior>
        <chart:ChartTrackballBehavior DisplayMode="FloatAllPoints"/>
    </chart:SfCartesianChart.TrackballBehavior>

    <!-- Configure additional chart elements -->
</chart:SfCartesianChart>
SfCartesianChart chart = new SfCartesianChart();
// Configure additional chart elements
ChartTrackballBehavior behavior = new ChartTrackballBehavior()
{
DisplayMode = LabelDisplayMode.FloatAllPoints
};
chart.TrackballBehavior = behavior;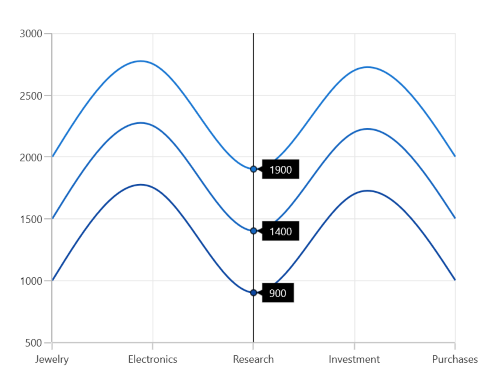
NearestPoint
<chart:SfCartesianChart>
    <chart:SfCartesianChart.TrackballBehavior>
        <chart:ChartTrackballBehavior DisplayMode="NearestPoint"/>
    </chart:SfCartesianChart.TrackballBehavior>
</chart:SfCartesianChart>
SfCartesianChart chart = new SfCartesianChart();
// Configure additional chart elements
ChartTrackballBehavior behavior = new ChartTrackballBehavior()
{
DisplayMode = LabelDisplayMode.NearestPoint
};
chart.TrackballBehavior = behavior;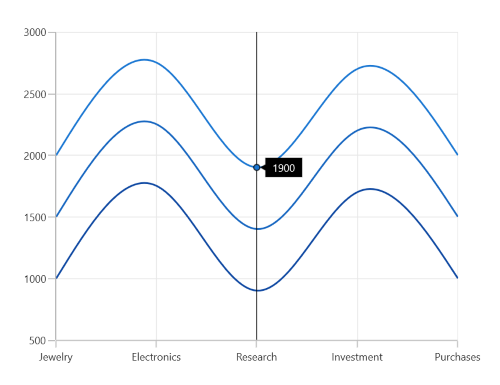
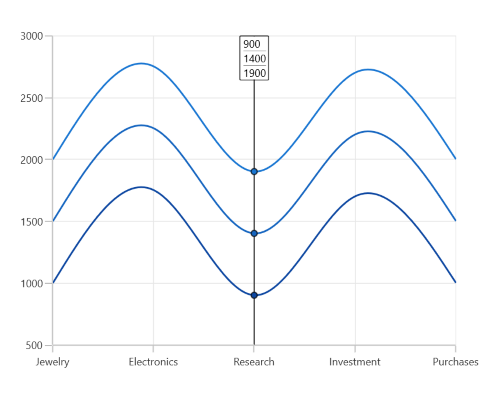
GroupAllPoints
ChartTrackballBehavior supports grouping the multiple trackball points, and allows you to display the trackball points in a single trackball label. It can be achieved by setting the DisplayMode property of ChartTrackballBehavior as GroupAllPoints.
<chart:SfCartesianChart>
    <chart:SfCartesianChart.TrackballBehavior>
        <chart:ChartTrackballBehavior DisplayMode="GroupAllPoints"/>
    </chart:SfCartesianChart.TrackballBehavior>

    <!-- Configure additional chart elements -->
</chart:SfCartesianChart>
SfCartesianChart chart = new SfCartesianChart();
// Configure additional chart elements
ChartTrackballBehavior behavior = new ChartTrackballBehavior()
{
DisplayMode = LabelDisplayMode.GroupAllPoints
};
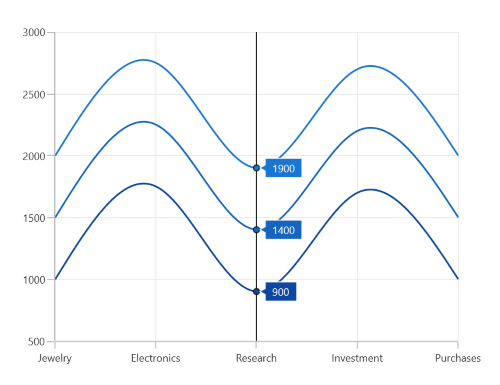
chart.TrackballBehavior = behavior;The following screenshot illustrates the trackball label for multiple series, when the DisplayMode property value is GroupAllPoints.
Template
The TrackballLabelTemplate property is used to customize the appearance of the series label in the trackball.
<chart:SfCartesianChart>

    <!-- Configure additional chart elements -->
    <chart:SfCartesianChart.Resources>
        <DataTemplate x:Key="labelTemplate" x:DataType="chart:ChartPointInfo">
            <Border
                CornerRadius="5"
                BorderThickness="1"
                BorderBrush="Black"
                Background="LightGreen"
                Padding="5">
                <TextBlock Foreground="Black" Text="{Binding ValueY}"/>
            </Border>
        </DataTemplate>
    </chart:SfCartesianChart.Resources>

    <chart:SfCartesianChart.TrackballBehavior>
        <chart:ChartTrackballBehavior/>
    </chart:SfCartesianChart.TrackballBehavior>

    <chart:SfCartesianChart.Series>
        <chart:ColumnSeries
            ItemsSource="{Binding Data}"
            XBindingPath="Demand"
            YBindingPath="Year2010"
            TrackballLabelTemplate="{StaticResource labelTemplate}">
        </chart:ColumnSeries>
    </chart:SfCartesianChart.Series>

</chart:SfCartesianChart>
SfCartesianChart chart = new SfCartesianChart();
// Configure additional chart elements
ChartTrackballBehavior Trackball = new ChartTrackballBehavior();
chart.TrackballBehavior = Trackball;
// The 'labelTemplate' resource is defined in XAML Resources and referenced here.
ColumnSeries series = new ColumnSeries()
{
ItemsSource = new ViewModel().Data,
XBindingPath = "Demand",
YBindingPath = "Year2010",
TrackballLabelTemplate = chart.Resources["labelTemplate"] as DataTemplate,
};
chart.Series.Add(series);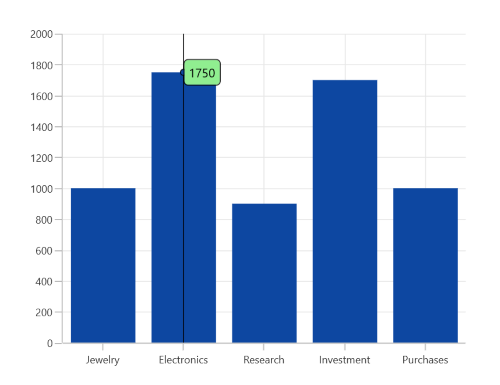
NOTE
The binding context for Chart
TrackballLabelTemplateis ChartPointInfo, which provides the necessary data for the trackball labels.
Applying Series Interior
The interior color of the series is applied to the series label by setting UseSeriesPalette to true as shown in the following code snippet.
<chart:SfCartesianChart>
    <chart:SfCartesianChart.TrackballBehavior>
        <chart:ChartTrackballBehavior UseSeriesPalette="True"/>
    </chart:SfCartesianChart.TrackballBehavior>

    <!-- Configure additional chart elements -->
</chart:SfCartesianChart>
SfCartesianChart chart = new SfCartesianChart();
// Configure additional chart elements
ChartTrackballBehavior behavior = new ChartTrackballBehavior()
{
UseSeriesPalette = true
};
chart.TrackballBehavior = behavior;