Class SfCartesianChart
Renders different types of cartesian-type charts, each representing a unique style of representing data with a more user-friendly and greater UI visualization.
Implements
Inherited Members
Namespace: Syncfusion.UI.Xaml.Charts
Assembly: Syncfusion.Chart.WinUI.dll
Syntax
public class SfCartesianChart : ChartBase, IDisposable, INotifyPropertyChangedRemarks
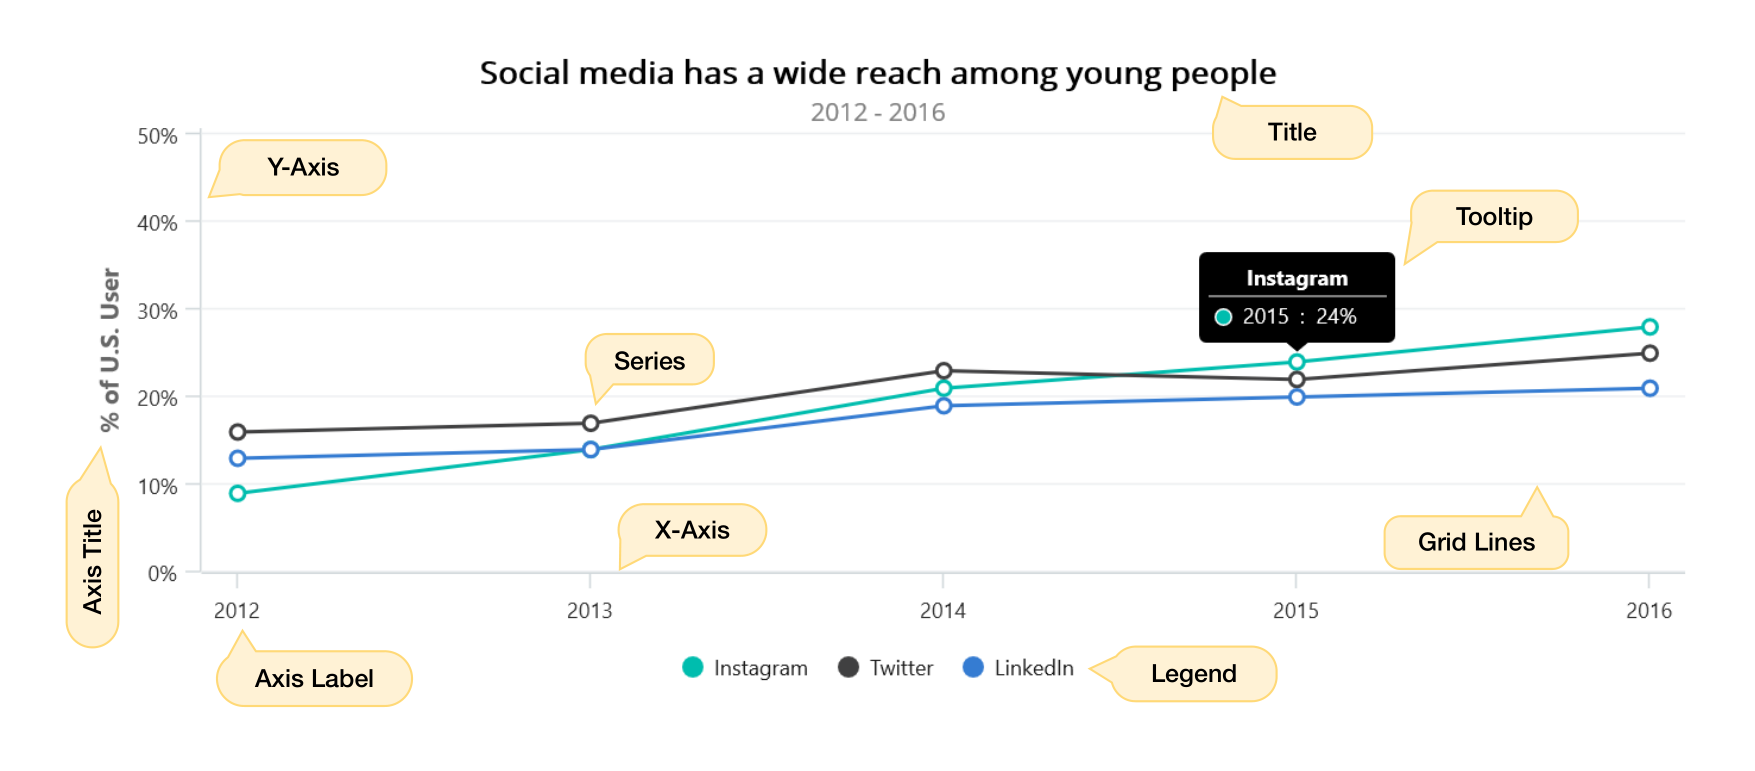
The Cartesian chart control is used to visualize the data graphically, it typically have horizontal and vertical axes.
SfCartesianChart class properties provides an option to add the series and axis collection, allows to customize the chart elements such as series, axis, legend, data label and tooltip features.
Axis
ChartAxis is used to locate a data point inside the chart area. Charts typically have two axes that are used to measure and categorize data. Vertical(Y) axis always uses numerical scale. Horizontal(X) axis supports the Category, Numeric and Date time.
To render an axis, the chart axis instance has to be added in chart’s XAxes and YAxes collection as per the following code snippet.
<chart:SfCartesianChart>

        <chart:SfCartesianChart.DataContext>
            <local:ViewModel/>
        </chart:SfCartesianChart.DataContext>

        <chart:SfCartesianChart.XAxes>
            <chart:NumericalAxis/>
        </chart:SfCartesianChart.XAxes>

        <chart:SfCartesianChart.YAxes>
            <chart:NumericalAxis/>
        </chart:SfCartesianChart.YAxes>

</chart:SfCartesianChart>Series
ChartSeries is the visual representation of data. SfCartesianChart offers many types such as Line, Fast line, Fast column, Fast scatter, Fast step line, Spline, Column, Scatter, Bubble, Area and SplineArea series. Based on your requirements and specifications, any type of series can be added for data visualization.
To render a series, create an instance of required series class, and add it to the Series collection.
<chart:SfCartesianChart>

       <chart:SfCartesianChart.DataContext>
           <local:ViewModel/>
       </chart:SfCartesianChart.DataContext>

       <chart:SfCartesianChart.XAxes>
           <chart:NumericalAxis/>
       </chart:SfCartesianChart.XAxes>

       <chart:SfCartesianChart.YAxes>
           <chart:NumericalAxis/>
       </chart:SfCartesianChart.YAxes>

       <chart:SfCartesianChart.Series>
           <chart:LineSeries ItemsSource = "{Binding Data}" XBindingPath="XValue" YBindingPath="YValue1"/>
           <chart:LineSeries ItemsSource = "{Binding Data}" XBindingPath="XValue" YBindingPath="YValue2"/>
       </chart:SfCartesianChart.Series>
</chart:SfCartesianChart>Legend
The Legend contains list of chart series or data points in chart. The information provided in each legend item helps to identify the corresponding data series in chart. The Series Label property text will be displayed in the associated legend item.
To render a legend, create an instance of ChartLegend, and assign it to the Legend property.
<chart:SfCartesianChart>

       <chart:SfCartesianChart.DataContext>
           <local:ViewModel/>
       </chart:SfCartesianChart.DataContext>

       <chart:SfCartesianChart.Legend>
           <chart:ChartLegend/>
       </chart:SfCartesianChart.Legend>

       <chart:SfCartesianChart.XAxes>
           <chart:NumericalAxis/>
       </chart:SfCartesianChart.XAxes>

       <chart:SfCartesianChart.YAxes>
           <chart:NumericalAxis/>
       </chart:SfCartesianChart.YAxes>

       <chart:SfCartesianChart.Series>
           <chart:LineSeries Label="Singapore" ItemsSource = "{Binding Data}" XBindingPath="XValue" YBindingPath="YValue1"/>
           <chart:LineSeries Label="Spain" ItemsSource = "{Binding Data}" XBindingPath="XValue" YBindingPath="YValue2"/>
       </chart:SfCartesianChart.Series>
</chart:SfCartesianChart>Tooltip
Tooltip displays information while tapping or mouse hover on the segment. To display the tooltip on chart, you need to set the EnableTooltip property as true in ChartSeries.
To customize the appearance of the tooltip elements like Background, TextColor and Font, create an instance of ChartTooltipBehavior class, modify the values, and assign it to the chart’s TooltipBehavior property.
<chart:SfCartesianChart>

        <chart:SfCartesianChart.DataContext>
            <local:ViewModel/>
        </chart:SfCartesianChart.DataContext>

        <chart:SfCartesianChart.TooltipBehavior>
            <chart:ChartTooltipBehavior/>
        </chart:SfCartesianChart.TooltipBehavior>

        <chart:SfCartesianChart.XAxes>
            <chart:NumericalAxis/>
        </chart:SfCartesianChart.XAxes>

        <chart:SfCartesianChart.YAxes>
            <chart:NumericalAxis/>
        </chart:SfCartesianChart.YAxes>

        <chart:SfCartesianChart.Series>
            <chart:LineSeries EnableTooltip="True"
                              ItemsSource="{Binding Data}"
                              XBindingPath="XValue"
                              YBindingPath="YValue1"/>
            <chart:LineSeries EnableTooltip="True"
                              ItemsSource="{Binding Data}"
                              XBindingPath="XValue"
                              YBindingPath="YValue2"/>
        </chart:SfCartesianChart.Series>

</chart:SfCartesianChart>Data Label
Data labels are used to display values related to a chart segment. To render the data labels, you need to enable the ShowDataLabels property as true in DataMarkerSeries class.
To customize the chart data labels alignment, placement and label styles, need to create an instance of CartesianDataLabelSettings and set to the DataLabelSettings property.
<chart:SfCartesianChart>

       <chart:SfCartesianChart.DataContext>
           <local:ViewModel/>
       </chart:SfCartesianChart.DataContext>

       <chart:SfCartesianChart.XAxes>
           <chart:NumericalAxis/>
       </chart:SfCartesianChart.XAxes>

       <chart:SfCartesianChart.YAxes>
           <chart:NumericalAxis/>
       </chart:SfCartesianChart.YAxes>

       <chart:SfCartesianChart.Series>
           <chart:ColumnSeries ShowDataLabels="True"
                               ItemsSource="{Binding Data}"
                               XBindingPath="XValue"
                               YBindingPath="YValue1"/>
       </chart:SfCartesianChart.Series>
</chart:SfCartesianChart>Zooming and Panning
SfCartesianChart allows you to zoom the chart area with the help of the zoom feature. This behavior is mostly used to view the data point in the specific area, when there are large number of data points inside the chart.
Zooming and panning provides you to take a close-up look of the data point plotted in the series. To enable the zooming and panning in the chart, create an instance of ChartZoomPanBehavior and set it to the ZoomPanBehavior property of SfCartesianChart.
<chart:SfCartesianChart>

       <chart:SfCartesianChart.DataContext>
           <local:ViewModel/>
       </chart:SfCartesianChart.DataContext>

       <chart:SfCartesianChart.ZoomPanBehavior>
           <chart:ChartZoomPanBehavior EnablePanning = "True" EnableDoubleTap="True" EnablePinchZooming="True"/>
       </chart:SfCartesianChart.ZoomPanBehavior>

       <chart:SfCartesianChart.XAxes>
           <chart:NumericalAxis/>
       </chart:SfCartesianChart.XAxes>

       <chart:SfCartesianChart.YAxes>
           <chart:NumericalAxis/>
       </chart:SfCartesianChart.YAxes>

       <chart:SfCartesianChart.Series>
            <chart:LineSeries ItemsSource="{Binding Data}"
                              XBindingPath="XValue"
                              YBindingPath="YValue1"/>
            <chart:LineSeries ItemsSource="{Binding Data}"
                              XBindingPath="XValue"
                              YBindingPath="YValue2"/>
        </chart:SfCartesianChart.Series>
</chart:SfCartesianChart>Selection
SfCartesianChart allows you to select or highlight a segment or series in the chart by using ChartSelectionBehavior.
SfCartessianChart provides seperate behaviors for series and segment selection. To enable the series selection in the chart, create an instance of SeriesSelectionBehavior and set it to the SelectionBehavior property of SfCartesianChart.
<chart:SfCartesianChart>

       <chart:SfCartesianChart.DataContext>
           <local:ViewModel/>
       </chart:SfCartesianChart.DataContext>

       <chart:SfCartesianChart.SelectionBehavior>
           <chart:SeriesSelectionBehavior SelectionBrush="Red"/>
       </chart:SfCartesianChart.SelectionBehavior>

       <chart:SfCartesianChart.XAxes>
           <chart:NumericalAxis/>
       </chart:SfCartesianChart.XAxes>

       <chart:SfCartesianChart.YAxes>
           <chart:NumericalAxis/>
       </chart:SfCartesianChart.YAxes>

       <chart:SfCartesianChart.Series>
            <chart:ColumnSeries ItemsSource="{Binding Data}"
                                XBindingPath="XValue"
                                YBindingPath="YValue1"/>
            <chart:ColumnSeries ItemsSource="{Binding Data}"
                                XBindingPath="XValue"
                                YBindingPath="YValue2"/>
        </chart:SfCartesianChart.Series>
</chart:SfCartesianChart>DataPointSelectionBehavior is applicable only to certain series such as ColumnSeries, AreaSeries, BubbleSeries, LineSeries, ScatterSeries, SplineSeries, SplineAreaSeries, StackedAreaSeries, StackedColumnSeries, StepAreaSeries, StepLineSeries.
To enable the segment selection in the chart, create an instance of DataPointSelectionBehavior and set it to the SelectionBehavior property of series.
<chart:SfCartesianChart>

       <chart:SfCartesianChart.DataContext>
           <local:ViewModel/>
       </chart:SfCartesianChart.DataContext>

       <chart:SfCartesianChart.XAxes>
           <chart:NumericalAxis/>
       </chart:SfCartesianChart.XAxes>

       <chart:SfCartesianChart.YAxes>
           <chart:NumericalAxis/>
       </chart:SfCartesianChart.YAxes>

        <chart:SfCartesianChart.Series>
            <chart:ColumnSeries ItemsSource = "{Binding Data}" XBindingPath="XValue" YBindingPath="YValue1">
                <chart:ColumnSeries.SelectionBehavior>
                    <chart:DataPointSelectionBehavior SelectionBrush = "Green" />
                </chart:ColumnSeries.SelectionBehavior>
            </chart:ColumnSeries>
        </chart:SfCartesianChart.Series>
</chart:SfCartesianChart>Cross Hair
SfCartesianChart allows you to view the informations related to chart coordinates, at mouse over position or at touch contact point inside a chart.
ChartCrosshairBehavior displays a vertical line, horizontal line and a popup like control displaying information about the data point at touch contact point or at mouse over position. To enable the crosshair in the chart, create an instance of ChartCrosshairBehavior and set it to the CrosshairBehavior property of SfCartesianChart.
<chart:SfCartesianChart>

       <chart:SfCartesianChart.DataContext>
           <local:ViewModel/>
       </chart:SfCartesianChart.DataContext>

       <chart:SfCartesianChart.CrosshairBehavior>
           <chart:ChartCrosshairBehavior/>
       </chart:SfCartesianChart.CrosshairBehavior>

       <chart:SfCartesianChart.XAxes>
           <chart:NumericalAxis/>
       </chart:SfCartesianChart.XAxes>

       <chart:SfCartesianChart.YAxes>
           <chart:NumericalAxis/>
       </chart:SfCartesianChart.YAxes>

       <chart:SfCartesianChart.Series>
            <chart:LineSeries ItemsSource="{Binding Data}"
                              XBindingPath="XValue"
                              YBindingPath="YValue1"/>
            <chart:LineSeries ItemsSource="{Binding Data}"
                              XBindingPath="XValue"
                              YBindingPath="YValue2"/>
        </chart:SfCartesianChart.Series>
</chart:SfCartesianChart>Track Ball
SfCartesianChart allows you to view tooltip for the data points that are nearer to mouse over position or at touch contact point in a Chart.
To enable the track ball in the chart, create an instance of ChartTrackballBehavior and set it to the TrackballBehavior property of SfCartesianChart.
To view the trackball label in the particular axis, you have to enable the ShowTrackballLabel property in that axis.
<chart:SfCartesianChart>

       <chart:SfCartesianChart.DataContext>
           <local:ViewModel/>
       </chart:SfCartesianChart.DataContext>

       <chart:SfCartesianChart.TrackballBehavior>
           <chart:ChartTrackballBehavior/>
       </chart:SfCartesianChart.TrackballBehavior>

       <chart:SfCartesianChart.XAxes>
           <chart:NumericalAxis ShowTrackballLabel="true"/>
       </chart:SfCartesianChart.XAxes>

       <chart:SfCartesianChart.YAxes>
           <chart:NumericalAxis/>
       </chart:SfCartesianChart.YAxes>

       <chart:SfCartesianChart.Series>
            <chart:LineSeries ItemsSource="{Binding Data}"
                              XBindingPath="XValue"
                              YBindingPath="YValue1"/>
            <chart:LineSeries ItemsSource="{Binding Data}"
                              XBindingPath="XValue"
                              YBindingPath="YValue2"/>
        </chart:SfCartesianChart.Series>
</chart:SfCartesianChart>Constructors
SfCartesianChart()
Initializes a new instance of the SfCartesianChart class.
Declaration
public SfCartesianChart()Fields
CrosshairBehaviorProperty
The DependencyProperty for CrosshairBehavior property.
Declaration
public static readonly DependencyProperty CrosshairBehaviorPropertyField Value
| Type |
|---|
| Microsoft.UI.Xaml.DependencyProperty |
EnableSideBySideSeriesPlacementProperty
Identifies the EnableSideBySideSeriesPlacement dependency property.
Declaration
public static readonly DependencyProperty EnableSideBySideSeriesPlacementPropertyField Value
| Type | Description |
|---|---|
| Microsoft.UI.Xaml.DependencyProperty | The identifier for |
IsTransposedProperty
The DependencyProperty for IsTransposed property.
Declaration
public static readonly DependencyProperty IsTransposedPropertyField Value
| Type |
|---|
| Microsoft.UI.Xaml.DependencyProperty |
PaletteBrushesProperty
Identifies the PaletteBrushes dependency property.
Declaration
public static readonly DependencyProperty PaletteBrushesPropertyField Value
| Type | Description |
|---|---|
| Microsoft.UI.Xaml.DependencyProperty | The identifier for |
PlotAreaBackgroundProperty
Identifies the PlotAreaBackground dependency property.
Declaration
public static readonly DependencyProperty PlotAreaBackgroundPropertyField Value
| Type | Description |
|---|---|
| Microsoft.UI.Xaml.DependencyProperty | The identifier for |
PlotAreaBorderBrushProperty
Identifies the PlotAreaBorderBrush dependency property.
Declaration
public static readonly DependencyProperty PlotAreaBorderBrushPropertyField Value
| Type | Description |
|---|---|
| Microsoft.UI.Xaml.DependencyProperty | The identifier for |
PlotAreaBorderThicknessProperty
Identifies the PlotAreaBorderThickness dependency property.
Declaration
public static readonly DependencyProperty PlotAreaBorderThicknessPropertyField Value
| Type | Description |
|---|---|
| Microsoft.UI.Xaml.DependencyProperty | The identifier for |
SelectionBehaviorProperty
The DependencyProperty for SelectionBehavior property.
Declaration
public static readonly DependencyProperty SelectionBehaviorPropertyField Value
| Type |
|---|
| Microsoft.UI.Xaml.DependencyProperty |
SeriesProperty
Identifies the Series dependency property.
Declaration
public static readonly DependencyProperty SeriesPropertyField Value
| Type | Description |
|---|---|
| Microsoft.UI.Xaml.DependencyProperty | The identifier for |
TrackballBehaviorProperty
The DependencyProperty for TrackballBehavior property.
Declaration
public static readonly DependencyProperty TrackballBehaviorPropertyField Value
| Type |
|---|
| Microsoft.UI.Xaml.DependencyProperty |
ZoomPanBehaviorProperty
The DependencyProperty for ZoomPanBehavior property.
Declaration
public static readonly DependencyProperty ZoomPanBehaviorPropertyField Value
| Type |
|---|
| Microsoft.UI.Xaml.DependencyProperty |
Properties
CrosshairBehavior
Gets or sets a value that allows the crosshair to display the cursor position in the chart.
Declaration
public ChartCrosshairBehavior CrosshairBehavior { get; set; }Property Value
| Type | Description |
|---|---|
| ChartCrosshairBehavior | This property takes the ChartCrosshairBehavior value and its default value is null. |
Examples
    <chart:SfCartesianChart>

          <chart:SfCartesianChart.DataContext>
              <local:ViewModel/>
          </chart:SfCartesianChart.DataContext>

          <chart:SfCartesianChart.CrosshairBehavior>
              <chart:ChartCrosshairBehavior />
          </chart:SfCartesianChart.CrosshairBehavior>

          <chart:SfCartesianChart.XAxes>
              <chart:NumericalAxis/>
          </chart:SfCartesianChart.XAxes>

          <chart:SfCartesianChart.YAxes>
              <chart:NumericalAxis/>
          </chart:SfCartesianChart.YAxes>

          <chart:LineSeries ItemsSource="{Binding Data}"
                            XBindingPath="XValue"
                            YBindingPath="YValue1"/>

</chart:SfCartesianChart>EnableSideBySideSeriesPlacement
Gets or sets a System.Boolean value that indicates whether the series are placed side by side or overlapped.
Declaration
public bool EnableSideBySideSeriesPlacement { get; set; }Property Value
| Type | Description |
|---|---|
| System.Boolean | This proeprty takes the boolean value and its default value is |
Remarks
If the value is true, series placed side by side, else series rendered one over other(overlapped).
IsTransposed
Gets or sets a System.Boolean value that indicates whether to change the cartesian chart orientation.
Declaration
public bool IsTransposed { get; set; }Property Value
| Type | Description |
|---|---|
| System.Boolean | This proeprty takes the boolean value and its default value is |
Remarks
If the value is true, the orientation of x-axis is set to vertical and orientation of y-axis is set to horizontal.
PaletteBrushes
Gets or sets the palette brushes for chart.
Declaration
public IList<Brush> PaletteBrushes { get; set; }Property Value
| Type | Description |
|---|---|
| System.Collections.Generic.IList<Microsoft.UI.Xaml.Media.Brush> | This property takes the list of Microsoft.UI.Xaml.Media.Brush and its default value is predefined palette. |
PlotAreaBackground
Gets or sets the brush value to customize the background appearance of the chart area.
Declaration
public Brush PlotAreaBackground { get; set; }Property Value
| Type | Description |
|---|---|
| Microsoft.UI.Xaml.Media.Brush | It accepts Microsoft.UI.Xaml.Media.Brush value. |
PlotAreaBorderBrush
Gets or sets the brush value to customize the outline appearance of the chart area.
Declaration
public Brush PlotAreaBorderBrush { get; set; }Property Value
| Type | Description |
|---|---|
| Microsoft.UI.Xaml.Media.Brush | It accepts Microsoft.UI.Xaml.Media.Brush value. |
PlotAreaBorderThickness
Gets or sets the value to customize the outline thickness of chart area.
Declaration
public Thickness PlotAreaBorderThickness { get; set; }Property Value
| Type | Description |
|---|---|
| Microsoft.UI.Xaml.Thickness | It accepts Microsoft.UI.Xaml.Thickness value. |
SelectionBehavior
Gets or sets a value for initiating selection or highlighting of a single or multiple series in the chart.
Declaration
public SeriesSelectionBehavior SelectionBehavior { get; set; }Property Value
| Type | Description |
|---|---|
| SeriesSelectionBehavior | This property takes a SeriesSelectionBehavior instance as a value, and its default value is null. |
Examples
<chart:SfCartesianChart>
        <chart:SfCartesianChart.XAxes>
            <chart:DateTimeAxis/>
        </chart:SfCartesianChart.XAxes>
        <chart:SfCartesianChart.YAxes>
            <chart:NumericalAxis/>
        </chart:SfCartesianChart.YAxes>
        <chart:SfCartesianChart.SelectionBehavior>
            <chart:SeriesSelectionBehavior/>
        </chart:SfCartesianChart.SelectionBehavior>
        <chart:ColumnSeries ItemsSource="{Binding Data}"
                            XBindingPath="Date"
                            YBindingPath="High"/>
        <chart:ColumnSeries ItemsSource="{Binding Data}"
                            XBindingPath="Date"
                            YBindingPath="Low"/>
</chart:SfCircularChart>Series
Gets or sets a collection of chart series to be added to the cartesian chart.
Declaration
public CartesianSeriesCollection Series { get; set; }Property Value
| Type | Description |
|---|---|
| CartesianSeriesCollection | This property takes CartesianSeriesCollection instance as value. |
Remarks
To render a series, create an instance of required series class, and add it to the Series collection.
Examples
    <chart:SfCartesianChart>

       <chart:SfCartesianChart.DataContext>
           <local:ViewModel/>
       </chart:SfCartesianChart.DataContext>

       <chart:SfCartesianChart.XAxes>
           <chart:NumericalAxis/>
       </chart:SfCartesianChart.XAxes>

       <chart:SfCartesianChart.YAxes>
           <chart:NumericalAxis/>
       </chart:SfCartesianChart.YAxes>

       <chart:LineSeries ItemsSource="{Binding Data}"
                         XBindingPath="XValue"
                         YBindingPath="YValue1"/>
       <chart:LineSeries ItemsSource="{Binding Data}"
                         XBindingPath="XValue"
                         YBindingPath="YValue2"/>

</chart:SfCartesianChart>TrackballBehavior
Gets or sets a value that allows tracking a data point closer to the cursor position in the chart.
Declaration
public ChartTrackballBehavior TrackballBehavior { get; set; }Property Value
| Type | Description |
|---|---|
| ChartTrackballBehavior | This property takes the ChartTrackballBehavior value and its default value is null. |
Examples
    <chart:SfCartesianChart>

          <chart:SfCartesianChart.DataContext>
              <local:ViewModel/>
          </chart:SfCartesianChart.DataContext>

          <chart:SfCartesianChart.TrackballBehavior>
              <chart:ChartTrackballBehavior ShowLine="True" DisplayMode="GroupAllPoints"/>
          </chart:SfCartesianChart.TrackballBehavior>

          <chart:SfCartesianChart.XAxes>
              <chart:NumericalAxis/>
          </chart:SfCartesianChart.XAxes>

          <chart:SfCartesianChart.YAxes>
              <chart:NumericalAxis/>
          </chart:SfCartesianChart.YAxes>

          <chart:LineSeries ItemsSource="{Binding Data}"
                            XBindingPath="XValue"
                            YBindingPath="YValue1"/>

</chart:SfCartesianChart>XAxes
Gets the collection of horizontal axes in the chart.
Declaration
public ObservableCollection<ChartAxis> XAxes { get; }Property Value
| Type | Description |
|---|---|
| System.Collections.ObjectModel.ObservableCollection<ChartAxis> | Returns the collection of ChartAxis. |
Remarks
Horizontal(X) axis supports the Category, Numeric and Date time.
Examples
<chart:SfCartesianChart>

        <chart:SfCartesianChart.DataContext>
            <local:ViewModel/>
        </chart:SfCartesianChart.DataContext>

        <chart:SfCartesianChart.XAxes>
            <chart:NumericalAxis/>
        </chart:SfCartesianChart.XAxes>

</chart:SfCartesianChart>YAxes
Gets the collection of vertical axes in the chart.
Declaration
public ObservableCollection<RangeAxisBase> YAxes { get; }Property Value
| Type | Description |
|---|---|
| System.Collections.ObjectModel.ObservableCollection<RangeAxisBase> | Returns the collection of RangeAxisBase. |
Remarks
Vertical(Y) axis always uses numerical scale.
Examples
<chart:SfCartesianChart>

        <chart:SfCartesianChart.DataContext>
            <local:ViewModel/>
        </chart:SfCartesianChart.DataContext>

        <chart:SfCartesianChart.YAxes>
            <chart:NumericalAxis/>
        </chart:SfCartesianChart.YAxes>

</chart:SfCartesianChart>ZoomPanBehavior
Gets or sets a value for initiating the zooming and panning operations in chart.
Declaration
public ChartZoomPanBehavior ZoomPanBehavior { get; set; }Property Value
| Type | Description |
|---|---|
| ChartZoomPanBehavior | This property takes the ChartZoomPanBehavior value and its default value is null. |
Examples
    <chart:SfCartesianChart>

          <chart:SfCartesianChart.DataContext>
              <local:ViewModel/>
          </chart:SfCartesianChart.DataContext>

          <chart:SfCartesianChart.ZoomPanBehavior>
              <chart:ChartZoomPanBehavior EnablePinchZooming="True" EnablePanning="True"/>
          </chart:SfCartesianChart.ZoomPanBehavior>

          <chart:SfCartesianChart.XAxes>
              <chart:NumericalAxis/>
          </chart:SfCartesianChart.XAxes>

          <chart:SfCartesianChart.YAxes>
              <chart:NumericalAxis/>
          </chart:SfCartesianChart.YAxes>

          <chart:LineSeries ItemsSource="{Binding Data}"
                            XBindingPath="XValue"
                            YBindingPath="YValue1"/>

</chart:SfCartesianChart>Methods
OnApplyTemplate()
Declaration
protected override void OnApplyTemplate()