Selection in WinUI Chart (SfCartesianChart)
10 Jul 202612 minutes to read
Cartesian chart supports selection that allows you to select a segment or series in the chart by using the SelectionBehavior property.
Properties
The Selection feature can be configured using the following properties:
-
Type - Gets or Sets the ChartSelectionType Enum value for the Selection Behavior.
The followingChartSelectionTypecan be achieved during Selection:- Single - Allows to select a single segment or series.
- SingleDeselect - Allows to select and deselect a single segment or series.
- Multiple - Allows to select multiple segments or series.
- None - Restricts the segment or series selection.
- SelectionBrush - Gets or Sets the SelectionBrush color value for Selection Behavior.
- SelectedIndex - Gets or Sets the index value of the segment that should be selected during the Selection.
- SelectedIndexes - Gets or Sets the list of indexes of the segments that should be selected during the Selection.
Enable DataPoint Selection
To enable the datapoint selection in the chart, create an instance of DataPointSelectionBehavior and set it to the SelectionBehavior property of the chart series. You also need to set the SelectionBrush property to highlight the segment in the chart.
<chart:SfCartesianChart>

    <!-- Configure additional chart elements -->
    <chart:ColumnSeries
        ItemsSource="{Binding Data}"
        XBindingPath="Demand"
        YBindingPath="Year2010">
        <chart:ColumnSeries.SelectionBehavior>
            <chart:DataPointSelectionBehavior SelectionBrush="Red"/>
        </chart:ColumnSeries.SelectionBehavior>
    </chart:ColumnSeries>
</chart:SfCartesianChart>
SfCartesianChart chart = new SfCartesianChart();
// Configure additional chart elements
ColumnSeries series = new ColumnSeries()
{
ItemsSource = new ViewModel().Data,
XBindingPath = "Demand",
YBindingPath = "Year2010"
};
DataPointSelectionBehavior selection = new DataPointSelectionBehavior();
selection.SelectionBrush = new SolidColorBrush(Colors.Red);
series.SelectionBehavior = selection;
chart.Series.Add(series);
this.Content = chart;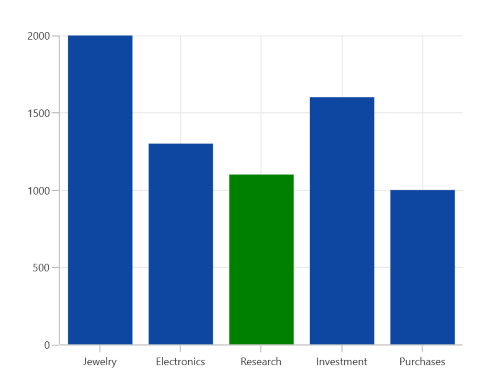
Segment Selection in Linear Series
In linear type series, the segment selection can be viewed by changing the data label interior.
The following code example demonstrates the spline series segment selection by changing the data label interior.
<chart:SfCartesianChart>

    <!-- Configure additional chart elements -->
    <chart:SplineSeries
        ItemsSource="{Binding Data}"
        XBindingPath="Demand"
        YBindingPath="Year2010"
        ShowDataLabels="True">
        <chart:SplineSeries.SelectionBehavior>
            <chart:DataPointSelectionBehavior SelectionBrush="Red"/>
        </chart:SplineSeries.SelectionBehavior>
    </chart:SplineSeries>
</chart:SfCartesianChart>
SfCartesianChart chart = new SfCartesianChart();
// Configure additional chart elements
SplineSeries series = new SplineSeries()
{
ItemsSource = new ViewModel().Data,
XBindingPath = "Demand",
YBindingPath = "Year2010",
ShowDataLabels="True"
};
DataPointSelectionBehavior selection = new DataPointSelectionBehavior();
selection.SelectionBrush = new SolidColorBrush(Colors.Red);
series.SelectionBehavior = selection;
chart.Series.Add(series);
this.Content = chart;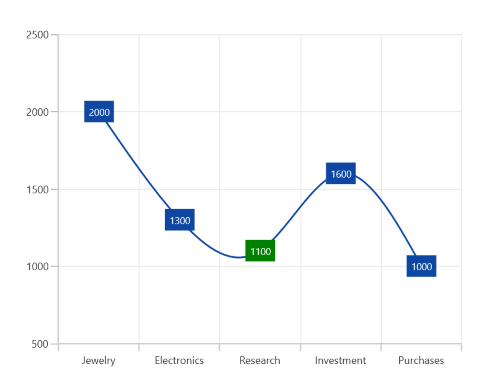
Enable Series Selection
Series selection is used to highlight a particular series when using multiple series. Series selection is enabled by creating an instance of SeriesSelectionBehavior and setting it to the SelectionBehavior property of SfCartesianChart. The SelectionBrush property is used to set the brush color to highlight the series.
<chart:SfCartesianChart>

    <!-- Configure additional chart elements -->
    <chart:SfCartesianChart.SelectionBehavior>
        <chart:SeriesSelectionBehavior SelectionBrush="Red"/>
    </chart:SfCartesianChart.SelectionBehavior>

</chart:SfCartesianChart>
SfCartesianChart chart = new SfCartesianChart();
// Configure additional chart elements
SeriesSelectionBehavior selection = new SeriesSelectionBehavior();
selection.SelectionBrush = new SolidColorBrush(Colors.Red);
chart.SelectionBehavior = selection;
this.Content = chart;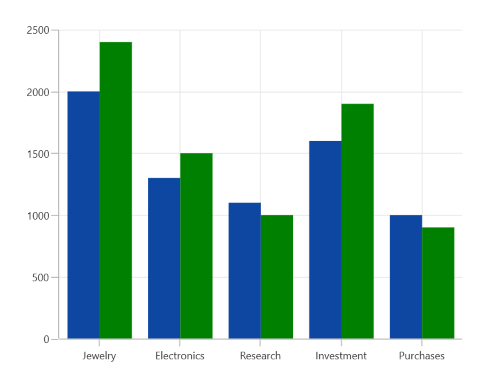
Multi-selection
Cartesian chart provides support to select single or multiple segments/series by using the Type property. Type property with Multiple value is used to select multiple segments/series. By default, the Type value is Single.
<chart:SfCartesianChart>

    <!-- Configure additional chart elements -->
    <chart:SfCartesianChart.Series>
        <chart:ColumnSeries
            ItemsSource="{Binding Data}"
            XBindingPath="Demand"
            YBindingPath="Year2010">
            <chart:ColumnSeries.SelectionBehavior>
                <chart:DataPointSelectionBehavior SelectionBrush="Red" Type="Multiple"/>
            </chart:ColumnSeries.SelectionBehavior>
        </chart:ColumnSeries>
    </chart:SfCartesianChart.Series>
</chart:SfCartesianChart>
SfCartesianChart chart = new SfCartesianChart();
// Configure additional chart elements
ColumnSeries series = new ColumnSeries()
{
ItemsSource = new ViewModel().Data,
XBindingPath = "Demand",
YBindingPath = "Year2010"
};
DataPointSelectionBehavior selection = new DataPointSelectionBehavior();
selection.SelectionBrush = new SolidColorBrush(Colors.Red);
selection.Type = ChartSelectionType.Multiple;
series.SelectionBehavior = selection;
chart.Series.Add(series);
this.Content = chart;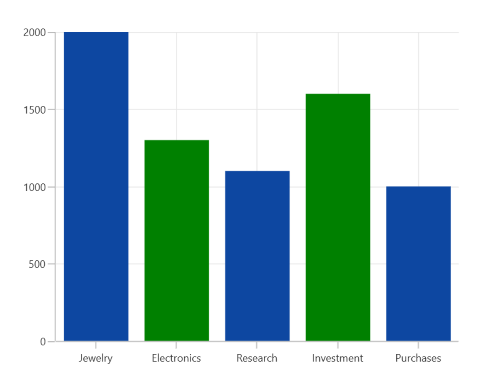
The following code snippet demonstrates multiple series selection.
<chart:SfCartesianChart>

    <!-- Configure additional chart elements -->
    <chart:SfCartesianChart.SelectionBehavior>
        <chart:SeriesSelectionBehavior SelectionBrush="Red" Type="Multiple"/>
    </chart:SfCartesianChart.SelectionBehavior>

</chart:SfCartesianChart>
SfCartesianChart chart = new SfCartesianChart();
// Configure additional chart elements
SeriesSelectionBehavior selection = new SeriesSelectionBehavior();
selection.SelectionBrush = new SolidColorBrush(Colors.Red);
selection.Type = ChartSelectionType.Multiple;
chart.SelectionBehavior = selection;
this.Content = chart;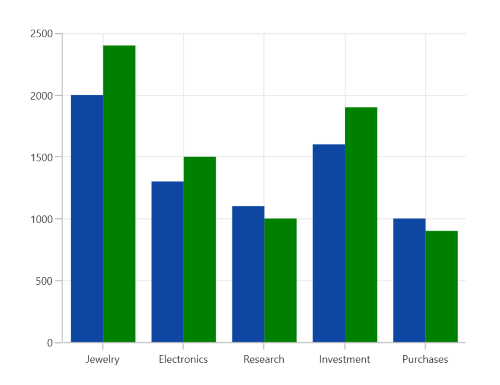
Selection on initial rendering
SelectedIndex
Cartesian chart provides support to select a point programmatically on a chart using the SelectedIndex property of DataPointSelectionBehavior.
<chart:SfCartesianChart>

    <!-- Configure additional chart elements -->
    <chart:SfCartesianChart.Series>
        <chart:ColumnSeries
            ItemsSource="{Binding Data}"
            XBindingPath="Demand"
            YBindingPath="Year2010">
            <chart:ColumnSeries.SelectionBehavior>
                <chart:DataPointSelectionBehavior SelectedIndex="3" SelectionBrush="Red"/>
            </chart:ColumnSeries.SelectionBehavior>
        </chart:ColumnSeries>
    </chart:SfCartesianChart.Series>
</chart:SfCartesianChart>
SfCartesianChart chart = new SfCartesianChart();
// Configure additional chart elements
ColumnSeries series = new ColumnSeries()
{
ItemsSource = new ViewModel().Data,
XBindingPath = "Demand",
YBindingPath = "Year2010"
};
DataPointSelectionBehavior selection = new DataPointSelectionBehavior();
selection.SelectionBrush = new SolidColorBrush(Colors.Red);
selection.SelectedIndex = 3;
series.SelectionBehavior = selection;
chart.Series.Add(series);
this.Content = chart;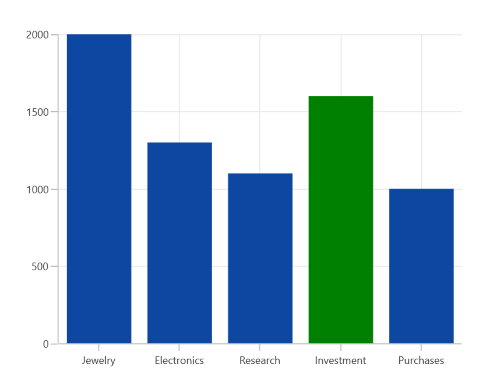
You can select a series programmatically on a chart using the SelectedIndex property of the SeriesSelectionBehavior.
<chart:SfCartesianChart>

    <!-- Configure additional chart elements -->
    <chart:SfCartesianChart.SelectionBehavior>
        <chart:SeriesSelectionBehavior SelectionBrush="Red" SelectedIndex="1"/>
    </chart:SfCartesianChart.SelectionBehavior>

</chart:SfCartesianChart>
SfCartesianChart chart = new SfCartesianChart();
// Configure additional chart elements
SeriesSelectionBehavior selection = new SeriesSelectionBehavior();
selection.SelectionBrush = new SolidColorBrush(Colors.Red);
selection.SelectedIndex = 1;
chart.SelectionBehavior = selection;
this.Content = chart;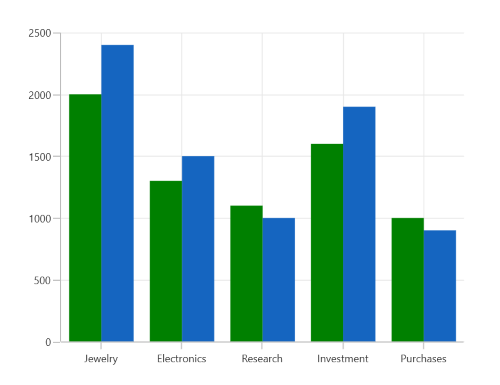
SelectedIndexes
Cartesian chart provides support to select multiple points programmatically on a chart using the SelectedIndexes property of DataPointSelectionBehavior.
<chart:SfCartesianChart>

    <!-- Configure additional chart elements -->
    <chart:ColumnSeries
        ItemsSource="{Binding Data}"
        XBindingPath="Demand"
        YBindingPath="Year2010">
        <chart:ColumnSeries.SelectionBehavior>
            <chart:DataPointSelectionBehavior
                SelectionBrush="BlueViolet"
                Type="Multiple"
                SelectedIndexes="{Binding SelectedIndexes}"/>
        </chart:ColumnSeries.SelectionBehavior>
    </chart:ColumnSeries>
</chart:SfCartesianChart>
SfCartesianChart chart = new SfCartesianChart();
// Configure additional chart elements
ColumnSeries series = new ColumnSeries()
{
ItemsSource = new ViewModel().Data,
XBindingPath = "Demand",
YBindingPath = "Year2010"
};
DataPointSelectionBehavior selection = new DataPointSelectionBehavior()
{
SelectionBrush = new SolidColorBrush(Colors.BlueViolet),
Type = ChartSelectionType.Multiple,
SelectedIndexes = new List<int>() { 1, 3 }
};
series.SelectionBehavior = selection;
chart.Series.Add(series);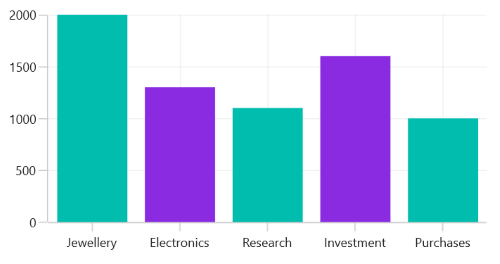
Events
The following selection events are available in the ChartSelectionBehavior.
SelectionChanging
The SelectionChanging event occurs before the data point or series is being selected. This is a cancelable event. The ChartSelectionChangingEventArgs contains the following information.
- NewIndexes - Gets the collection of selected data point or series index. Here, NewIndexes[0] is the current selected index.
- OldIndexes - Gets the collection of previous selected data point or series index. Here, OldIndexes[0] is the current unselected index.
- Cancel - Gets or sets a value that indicates whether the selection should be canceled.
SelectionChanged
The SelectionChanged event occurs after a data point or series has been selected. The ChartSelectionChangedEventArgs contains the following information.
- NewIndexes - Gets the collection of selected data point or series index. Here, NewIndexes[0] is the current selected index.
- OldIndexes - Gets the collection of previous selected data point or series index. Here, OldIndexes[0] is the current unselected index.