How can I help you?
Chart Area in WinUI Chart (SfCartesianChart)
2 Jan 20253 minutes to read
Chart area represents the entire chart and all its elements. It’s a virtual rectangular area that includes all the chart elements like title, axis, legends, series, etc.
Customization
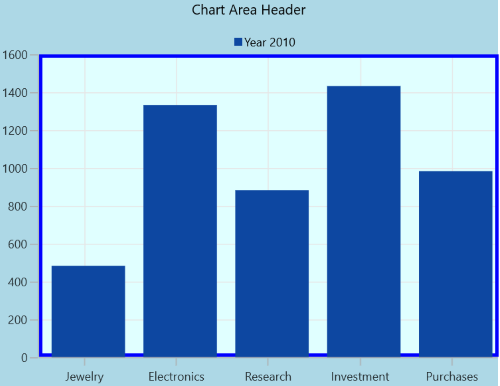
Chart provides the properties like PlotAreaBorderBrush, PlotAreaBorderThickness and PlotAreaBackground for customizing the plot area.
<chart:SfCartesianChart Header="Chart Area Header"
                        PlotAreaBackground="LightCyan"
                        Background="LightBlue"
                        PlotAreaBorderBrush="Blue"
                        PlotAreaBorderThickness="3">
. . .
    <chart:SfCartesianChart.XAxes>
        <chart:CategoryAxis/>
    </chart:SfCartesianChart.XAxes>

    <chart:SfCartesianChart.YAxes>
        <chart:NumericalAxis/>
    </chart:SfCartesianChart.YAxes>

    <chart:SfCartesianChart.Legend>
        <chart:ChartLegend/>
    </chart:SfCartesianChart.Legend>

    <chart:SfCartesianChart.Series>
        <chart:ColumnSeries ItemsSource="{Binding Data}"
                            XBindingPath="Demand"
                            YBindingPath="Year2010"
                            Label="Year 2010">
        </chart:ColumnSeries>
    </chart:SfCartesianChart.Series>

</chart:SfCartesianChart>
SfCartesianChart chart = new SfCartesianChart();
chart.Header = "Chart Area Header";
chart.PlotAreaBackground = new SolidColorBrush(Colors.LightCyan);
chart.PlotAreaBorderBrush = new SolidColorBrush(Colors.Blue);
chart.Background = new SolidColorBrush(Colors.LightBlue);
chart.PlotAreaBorderThickness = new Thickness(3);
CategoryAxis primaryAxis = new CategoryAxis();
chart.XAxes.Add(primaryAxis);
NumericalAxis secondaryAxis = new NumericalAxis();
chart.YAxes.Add(secondaryAxis);
ChartLegend legend = new ChartLegend();
chart.Legend = legend;
ColumnSeries series = new ColumnSeries()
{
ItemsSource = new ViewModel().Data,
XBindingPath = "Demand",
YBindingPath = "Year2010",
Label = "Year 2010"
};
chart.Series.Add(series);
this.Content = chart;