Windows Forms Chart Overview
7 Jan 20255 minutes to read
This section covers information on Essential® Chart control, its key features, prerequisites to use the control, its compatibility with various OS and browsers and finally the documentation details complimentary with the product. It comprises the following sub sections:
Introduction to Essential® Chart
Essential® Chart is an easily configurable, presentation quality business chart control. A unique point based Styles Architecture, easily extendable Data Model, easily extendable rendering model, native Date Handling and a unique Shared Data Model are the features that distinguish Essential® chart. This control has been created using C#, which means that it is a fully-managed .NET component, and has been specifically designed for use with Microsoft’s Visual Studio .NET.
Essential® Chart for Windows Forms is a perfect solution for developers looking to add advanced, feature rich, visually appealing charts to their Windows Forms applications. The product comes with numerous samples as well as an extensive documentation to guide you every step of the way.
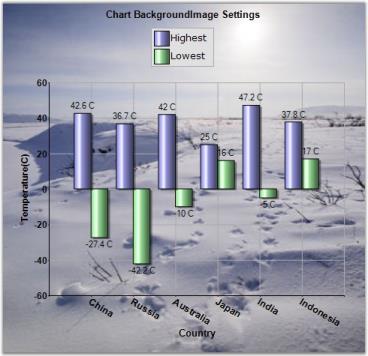
Chart is used as a means to show the graphical representation of two values. For Example, a Line Chart can be used in health Statistic reports, in which it can show the rates over time or for a series of values, such as age-specific death rates. Logarithmic charts can be used in Share price charts where we plot between price and time. In logarithmic chart, we can identify the ‘Proportional change in price’ with respect to the ‘Change in time’. We use ‘Proportional change in price’ to observe market sentiment. Market participants move share prices either up or down proportionally depending on how bullish or bearish they feel.
Key Features
Some of the key features of Essential® Chart are listed below.
- The control provides complete support for customization of the Chart control through Chart Wizard at design time and also at run time. Chart Wizard comes with new Office look and feel.
- Chart Data Model is an innovative data object model which makes it easy to populate the chart with any kind of data source.
- Essential® Chart features built in support for dates. The data type of any series that is plotted on the chart can be set to DateTime.
- Essential® Chart offers automatic interval calculation capabilities for any range of numbers or dates. This calculation can be overridden by explicit allocation of ranges and intervals to be used and also with settings that control how ‘nice’ numbers are calculated for display.
- Essential® Chart offers extensive customization possibilities of the legend. The position of the legend on the chart area as well as its representation aspects can all be completely customized. Essential® Chart also features modification of legend items using events. It also supports custom legend items that are not tied to series of data.
- Statistical formula means, Standard Deviation, Variance, Distributions, T-test, F-test and Z-test support etc.
- Exporting Chart to PDF, Excel and Doc etc., are available for the chart control. Importing is also supported.
- Users can create custom palettes for their Charts using CustomPalette property. Also, can create non-gradient palettes for the Charts using this custom palettes feature.
- Multiple Chart Titles and Multiple Legends can be provided with abilities to format the Title text.
- Chart Breaks are very useful when you use series points with large difference.
Prerequisites and Compatibility
This section covers the requirements mandatory for using Essential® Chart control. It also lists operating systems and browsers compatible with the product.
Prerequisites
The prerequisites details are listed in the following table.
| Development Environments | .NET Framework versions |
|---|---|
|
|
Compatibility
The compatibility details are listed in the following table.
| Operating Systems |
|---|
|
Control Structure
This section gives you an idea of the different sections of a Chart control. Below is the image that illustrates various sections of the control and their description in detail below.
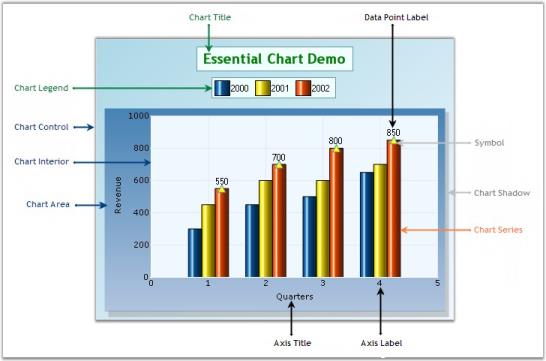
Chart Control
The ChartControl is the complete visible display for the Control. All other sections will be inside the ChartControl.
Chart Title
The Chart title is the area at the top of the Chart control that displays the text of the ChartControl.
Chart Legend
The Chart legend is the portion of the display showing an entry for each of the data series added to the ChartControl. The Chart legend is positioned in line within the ChartControl (but outside the ChartArea) by default. However, if the chart legend is set to floating mode, the Chart legend can be positioned anywhere inside the Chart control.
The legend can also contain custom items with custom image and text.
Chart Area
This is the section that holds the plots / graphs that are defined in the Chart. The Chart Area also includes the Chart axes that are defined. A primary X axis and primary Y axis are defined by default.
Axis Title
Indicates the title for individual axis.
Axis Label
Represents the label texts on the axes data points in a Chart.
Chart Interior
This section is the interior part of the chart control, within the chart area, which contains the data points plotted against X-axis and Y-axis.
Chart Series
Chart Series are the elements present inside the chart area.
Series Symbol
Symbol that can be placed on the series points.
Chart Shadow
Chart Area Shadow indicates the shadow of the chart area.
See Also
Text, Chart Legend, Chart Series, Chart Area, Axis Label Text Formatting, Appearance and Positioning, Customizing Label Text, Intersecting Labels, Grouping Labels
Documentation
Syncfusion® provides the following documentation segments to provide all necessary information for using Essential® Chart control in Windows application in an efficient manner.
| Type of documentation | Location |
|---|---|
| Release Notes |
https://help.syncfusion.com/windowsforms/release-notes/v16.1.0.32 |
| Class Reference | Click on this link. Select Chart from the second text box. Namespaces will be listed out at the left side of the page. |
NOTE
You can refer to our WinForms Chart control feature tour page for its groundbreaking feature representations. You can also explore our WinForms Chart example that shows how to render various chart types as well as how to easily configure with built-in support for creating stunning visual effects.