Events in Windows Forms Chart
7 Jan 202510 minutes to read
The following events are discussed in this section:
Chart Region Events
The Chart handles the following mouse related events when the user interacts with the Chart using mouse, on certain specific regions in the Chart - Axis Labels, Chart Points or a custom region.
- ChartRegionClick Event
- ChartRegionMouseEnter Event
- ChartRegionMouseHover Event
- ChartRegionMouseMove Event
- ChartRegionMouseLeave Event
- ChartRegionMouseUp Event
- ChartRegionMouseDown Event
- ChartRegionDoubleClick Event
The above events are raised with a ChartRegionMouseEventArgs that contain the following properties.
Properties
| ChartRegionMouseEventArgs Property | Description |
|---|---|
| Represents the client point where the event occurred. | |
| Returns the region associated with this event. | |
| Returns the right mouse button actions. |
The Region property above includes several useful information about the kind of region the user is currently interacting with.
| ChartRegion Property | Description |
|---|---|
| A text description of this region. | |
Specifies the type of region. Possible values:</br>
|
|
|
|
Indicates whether the region is a Chart Point in the ChartSeries. This simply checks if the above mentioned Type is SeriesPoint. |
| The index into the Series array of the Chart in which this point occurs if the Type is SeriesPoint. | |
| The index into the Points array of the ChartSeries in which this point occurs if the Type is SeriesPoint. | |
| The client region that represents this logical region. | |
| Specifies the tooltip for this region. |
ChartRegionDoubleClick and ChartRegionMouseDown Events:
//ChartRegionDoubleClick Event

this.chartControl1.ChartRegionDoubleClick += new Syncfusion.Windows.Forms.Chart.ChartRegionMouseEventHandler(this.chartControl1_ChartRegionDoubleClick);

private void chartControl1_ChartRegionDoubleClick(object sender, ChartRegionMouseEventArgs e)

{

    if (this.chartRegionDoubleClick.Checked)

    {

        if (e.Region.SeriesIndex == 0)

        {

            OutputText(String.Format("Double Click over Series 1 Column {0} Point : {1}", e.Region.PointIndex,e.Point));

            ShowChartRegion("ChartSeries");

        }

        else

        {

            OutputText(String.Format("Double Click over {0}", e.Region.Description.ToString()));

            ShowChartRegion(e.Region.Description.ToString());

        }

    }

}

//Usage of Button property in ChartRegionMouseDown Event

void chartControl1_ChartRegionMouseDown(object sender, ChartRegionMouseEventArgs e)

{

  if(e.Button==MouseButtons.Right)

     Console.WriteLine("Chart Region Mouse Down:="+e.Point.ToString());

}
'ChartRegionDoubleClick Event
AddHandler Me.chartControl1.ChartRegionDoubleClick, AddressOf Me.chartControl1_ChartRegionDoubleClick
Private Sub chartControl1_ChartRegionDoubleClick(ByVal sender As Object, ByVal e As ChartRegionMouseEventArgs)
If Me.chartRegionDoubleClick.Checked Then
If e.Region.SeriesIndex = 0 Then
OutputText([String].Format("Double Click over Series 1 Column {0} Point : {1}", e.Region.PointIndex, e.Point))
ShowChartRegion("ChartSeries")
Else
OutputText([String].Format("Double Click over {0}", e.Region.Description.ToString()))
ShowChartRegion(e.Region.Description.ToString())
End If
End If
End Sub
'Usage of Button property in ChartRegionMouseDown Event
Private Sub chartControl1_ChartRegionMouseDown(ByVal sender As Object, ByVal e As ChartRegionMouseEventArgs)
If e.Button = MouseButtons.Right Then
Console.WriteLine("Chart Region Mouse Down:="+e.Point.ToString())
End If
End SubVisibleRangeChanged Event
ChartControl provides various zooming options for the user while interacting with the Chart. The VisibleRangeChanged event will be raised when the visible range changes during the zooming operation.
private static void chartControl1_VisibleRangeChanged(object sender, EventArgs e)

{

Console.WriteLine("Visible Range Changed event is raised");

}
Private Sub chartControl1_VisibleRangeChanged(ByVal sender As Object, ByVal e As EventArgs)
Console.WriteLine("Visible Range Changed event is raised")
End SubChartFormatAxisLabel Event
CustomFormatAxisLabel event is discussed in detail in this topic: Customizing Label Text.
PrepareStyle Event
When a series point is about to be rendered by the chart, it will raise PrepareStyle event and allow event subscribers to change the style used.
//Listen to the prepare style event for the series.

series.PrepareStyle += new ChartPrepareStyleInfoHandler(series_PrepareStyle);

private void series_PrepareStyle(object sender, ChartPrepareStyleInfoEventArgs args)

{

    ChartSeries series = sender as ChartSeries ;

    if(series != null)

{

    //Condition to select members (data points) who made 100 % quota in sales

    if(((series.Points[args.Index].YValues[0] / 150) * 100) >= 100)

        {

          args.Style.Interior = new Syncfusion.Drawing.BrushInfo(Syncfusion.Drawing.GradientStyle.Horizontal, System.Drawing.                       Color.DarkGreen, System.Drawing.Color.LightYellow);

         }

}

}
'Listen to the prepare style event for the series.
AddHandler series.PrepareStyle, AddressOf Me.ChartControlSeries_PrepareStyle
Private Sub series_PrepareStyle(ByVal sender As Object, ByVal args As ChartPrepareStyleInfoEventArgs)
Dim series As ChartSeries = TryCast(sender, ChartSeries)
If series IsNot Nothing Then
'Condition to select members (data points) who made 100 % quota in sales
If ((series.Points(args.Index).YValues(0) / 150) * 100) >= 100 Then
args.Style.Interior = New Syncfusion.Drawing.BrushInfo(Syncfusion.Drawing.GradientStyle.Horizontal, System.Drawing.Color.DarkGreen, System.Drawing.Color.LightYellow)
End If
End If
End Sub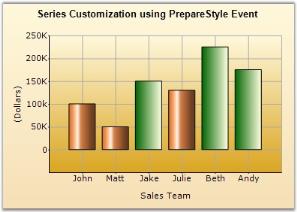
SeriesInCompatible Event
When the Chart has completed updating the series and finds out that series are incompatible, SeriesInCompatible event will be raised.
private static void chartControl1_SeriesInCompatible(object sender, EventArgs e)

{

Console.WriteLine("SeriesInCompatible event is raised");

}
Private Sub chartControl1_SeriesInCompatible(ByVal sender As Object, ByVal e As EventArgs)
Console.WriteLine("SeriesInCompatible event is raised")
End SubLayoutCompleted Event
LayoutCompleted event is handled every time, a resizing of chart is caused and when the chart re-renders itself. Listening to this event helps in cases where you render custom images over the chart or position custom controls over the chart.
private static void chartControl1_LayoutCompleted(object sender, EventArgs e)

{

Console.WriteLine("Layout Completed event is raised");

}
Private Sub chartControl1_LayoutCompleted(ByVal sender As Object, ByVal e As EventArgs)
Console.WriteLine("Layout Completed event is raised")
End SubChartAreaPaint Event
ChartAreaPaint event is discussed in Custom Drawing.
See Also
ChartLegendFilterItems Event
FilterItems event is discussed in detail in this topic: ChartLegend.
PreChartAreaPaint Event
PreChartAreaPaint event is raised before the chart area is painted.
this.chartControl1.PreChartAreaPaint += new System.Windows.Forms.PaintEventHandler(this.chartControl1_PreChartAreaPaint);

private void chartControl1_PreChartAreaPaint(object sender, PaintEventArgs e)
{
       this.chartControl1.BackColor = Color.Yellow;
}
AddHandler Me.chartControl1.PreChartAreaPaint, AddressOf Me.chartControl1_PreChartAreaPaint
Private Sub chartControl1_PreChartAreaPaint(ByVal sender As Object, ByVal e As PaintEventArgs)
Me.chartControl1.BackColor = Color.Yellow
End Sub