Chart Area in Windows Forms Chart
18 Nov 20186 minutes to read
The ChartArea is the rectangular plotting region in which the chart displays its axes and series.
Axis Spacing
The AxisSpacing property is useful when multiple axes are rendered on the same side of the chart area. By default, 2 pixels of spacing is applied between adjacent axes. Increasing the value adds more separation between them.
The following code adds 30 pixels of horizontal and vertical spacing between axes.
this.chartControl.ChartArea.AxisSpacing = new SizeF(30, 30);Me.chartControl.ChartArea.AxisSpacing = New SizeF(30, 30)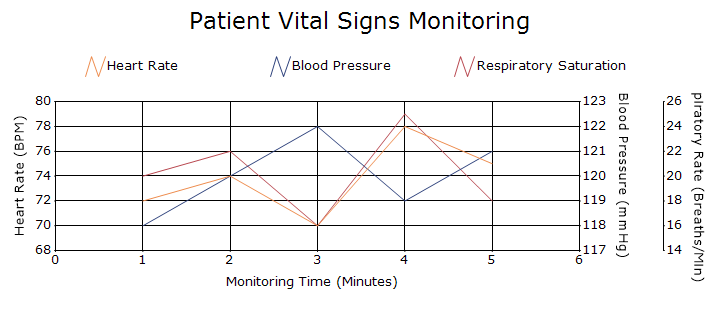
Full stack maximum
The FullStackMax property defines the total value represented by a complete stack in full-stacking chart types. Its default value is 100, causing the stacked segments to be calculated against a total value of 100.
The following code sets the full-stack maximum to 80.
chartControl.ChartArea.FullStackMax = 80;chartControl.ChartArea.FullStackMax = 80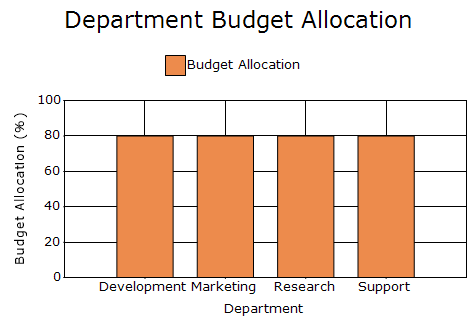
Dividing the chart area
Use DivideArea property divides a single chart area into equal sections for displaying Pie, Funnel, or Pyramid series separately. By default, the chart area is not divided.
Enabling DivideArea allows you to:
- Display the corresponding series name as the title of each section.
- Retrieve the bounds of an individual section.
- Render Pie series with the same radius.
VisibleAllPies property is deprecated. Use the DivideArea property instead. When DivideArea is enabled, the
ShowSeriesTitleproperty can display the title of each series in its corresponding section.
The following code divides the chart area for the supported series.
chartControl.ChartArea.DivideArea = true;chartControl.ChartArea.DivideArea = True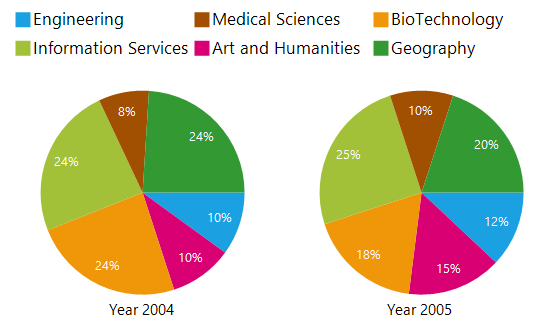
Displaying series titles
The series name can be displayed as the title of its corresponding section in a divided chart area. This helps identify the Pie, Funnel, or Pyramid series rendered in each section.
Use the ShowSeriesTitle property of the respective series configuration to display the series title.
// Displays the series title for a Pie series.
series.ConfigItems.PieItem.ShowSeriesTitle = true;
// Displays the series title for a Funnel series.
series.ConfigItems.FunnelItem.ShowSeriesTitle = true;
// Displays the series title for a Pyramid series.
series.ConfigItems.PyramidItem.ShowSeriesTitle = true;
' Displays the series title for a Pie series.
series.ConfigItems.PieItem.ShowSeriesTitle = True
' Displays the series title for a Funnel series.
series.ConfigItems.FunnelItem.ShowSeriesTitle = True
' Displays the series title for a Pyramid series.
series.ConfigItems.PyramidItem.ShowSeriesTitle = TrueRetrieving series bounds
The GetSeriesBounds method returns the rectangular bounds occupied by a series in the divided chart area.
The following code draws a border around every series section in the divided chart area.
private void chartControl_ChartAreaPaint(object sender, PaintEventArgs e)
{
    using (Pen borderPen = new Pen(Color.DimGray, 1))
    {
        foreach (ChartSeries series in this.chartControl.Series)
        {
            RectangleF seriesBounds = this.chartControl.ChartArea.GetSeriesBounds(series);
            e.Graphics.DrawRectangle(borderPen, seriesBounds.X, seriesBounds.Y, seriesBounds.Width, seriesBounds.Height);
        }
    }
}
Private Sub chartControl_ChartAreaPaint(sender As Object, e As PaintEventArgs)
Using borderPen As New Pen(Color.DimGray, 1)
For Each series As ChartSeries In Me.chartControl.Series
Dim seriesBounds As RectangleF = Me.chartControl.ChartArea.GetSeriesBounds(series)
e.Graphics.DrawRectangle(borderPen, seriesBounds.X, seriesBounds.Y, seriesBounds.Width, seriesBounds.Height)
Next
End Using
End Sub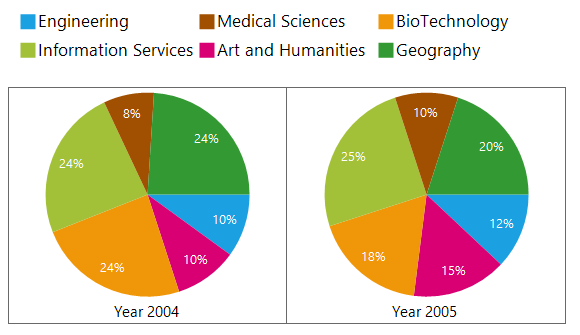
Retrieving the axes associated with a series
The GetXAxis and GetYAxis methods retrieve the X-axis and Y-axis associated with a specified series. These methods are useful when a chart contains multiple axes and you need to determine which axes are being used by a particular series.
ChartSeries series = this.chartControl.Series[0];
ChartAxis xAxis = this.chartControl.ChartArea.GetXAxis(series);
ChartAxis yAxis = this.chartControl.ChartArea.GetYAxis(series);
Dim series As ChartSeries = Me.chartControl.Series(0)
Dim xAxis As ChartAxis = Me.chartControl.ChartArea.GetXAxis(series)
Dim yAxis As ChartAxis = Me.chartControl.ChartArea.GetYAxis(series)