Hit Testing in Windows Forms Chart
7 Jan 20256 minutes to read
The section covers the below topics:
Chart Coordinates by Point
GetValueByPoint()
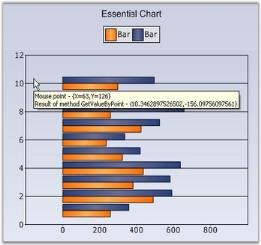
Using the GetValueByPoint method, the mouse position in chart client-coordinates can be converted into a corresponding Chart Coordinate in terms of x, y values.
The below figure shows a chart where the tooltip text for each point shows the corresponding x, y value at that position.
Code snippet for the above sample.
// Chart control mouse move event.

private void chartControl_MouseMove(object sender,System.Windows.Forms.MouseEventArgs e)

{

       ChartPoint point = this.chartControl.ChartArea.GetValueByPoint( new Point( e.X, e.Y ) );

       string text = "Result of method GetValueByPoint - {" + point.X.ToString() + "," + point.YValues[0].ToString() + "}" ;

       toolTip.SetToolTip( chartControl, text );

}
' ChartControl mouse move event.
Private Sub chartControl_MouseMove(ByVal sender As Object, ByVal e As System.Windows.Forms.MouseEventArgs)
Dim point As ChartPoint = Me.chartControl.ChartArea.GetValueByPoint(New Point(e.X, e.Y))
Dim [text] As String = "Result of method GetValueByPoint - {" + point.X.ToString() + "," + point.YValues(0).ToString() + "}"
toolTip.SetToolTip(chartControl, text)
End SubGetPointByValue()
The GetPointByValue method does the opposite of the above - given a chart coordinate it returns the client co-ordinate corresponding to that chart point.
LegendItem By Point
Get LegendItem By Point
The Legend.GetItemBy method will let you get the reference to a legend item at a specific point. Implementing the below code sample, will display a tooltip with legend item name, on which the user mouse hover.
private ToolTip toolTip2;

this.chartControl1.Legend.MouseHover += new MouseEventHandler(legend_MouseHover);

void legend_MouseHover(object sender, EventArgs e)

{

    Point p1 = this.chartControl1.Legend.PointToClient(new Point(Control.MousePosition.X, Control.MousePosition.Y));

    ChartLegendItem item = chartControl1.Legend.GetItemBy(p1);

    if (item != null)

        this.toolTip2.Show(item.Text, this.chartControl1.Legend, p1.X + 10, p1.Y + 20, 3000);

}
private toolTip2 As ToolTip
AddHandler Me.chartControl1.Legend.MouseHover, AddressOf legend_MouseHover
Private Sub legend_MouseHover(ByVal sender As Object, ByVal e As EventArgs)
' Get the item at the specified location..
Dim p1 As Point = Me.chartControl1.Legend.PointToClient(New Point(Control.MousePosition.X, Control.MousePosition.Y))
Dim item As ChartLegendItem = chartControl1.Legend.GetItemBy(p1)
If item IsNot Nothing Then
Me.toolTip2.Show(item.Text, this.chartControl1.Legend, p1.X + 10, p1.Y + 20, 3000)
End If
End Sub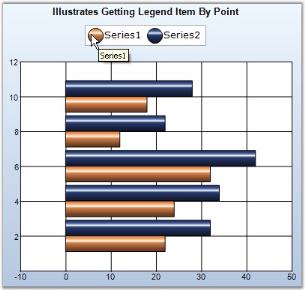
Chart Area Bounds
Full Chart Area Bounds
Use the Bounds property to get the rectangular area comprising the chart area that includes the axis, axis titles and other sections.
this.chartControl1.ChartAreaPaint += new System.Windows.Forms.PaintEventHandler(chartControl1_ChartAreaPaint);

void chartControl1_ChartAreaPaint(object sender, System.Windows.Forms.PaintEventArgs e)

{

    Rectangle axisBounds = this.chartControl1.ChartArea.Bounds;

   // Render a rectangle around this bounds

    e.Graphics.DrawRectangle(Pens.Red, axisBounds);

}
AddHandler Me.chartControl1.ChartAreaPaint, AddressOf chartControl1_ChartAreaPaint
Private Sub chartControl1_ChartAreaPaint(ByVal sender As Object, ByVal e As System.Windows.Forms.PaintEventArgs)
Dim axisBounds As Rectangle = Me.chartControl1.ChartArea.Bounds
' Render a rectangle around this bounds
e.Graphics.DrawRectangle(Pens.Red, axisBounds)
End Sub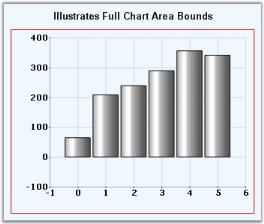
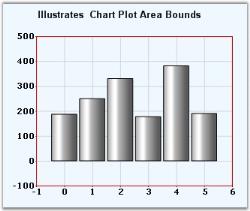
Chart Plot Area Bounds
Use the RenderBounds property to get the rectangular area comprising just the plot-area, bound by the axes.
this.chartControl1.ChartAreaPaint += new System.Windows.Forms.PaintEventHandler(chartControl1_ChartAreaPaint);

void chartControl1_ChartAreaPaint(object sender, System.Windows.Forms.PaintEventArgs e)

{

    Rectangle axisBounds = this.chartControl1.ChartArea.RenderBounds;

    // Render a rectangle around this bounds

    e.Graphics.DrawRectangle(Pens.Red, axisBounds);

}
AddHandler Me.chartControl1.ChartAreaPaint, AddressOf chartControl1_ChartAreaPaint
Private Sub chartControl1_ChartAreaPaint(ByVal sender As Object, ByVal e As System.Windows.Forms.PaintEventArgs)
Dim axisBounds As Rectangle = Me.chartControl1.ChartArea.RenderBounds
' Render a rectangle around this bounds
e.Graphics.DrawRectangle(Pens.Red, axisBounds)
End Sub