Visual Data Editing in WPF Charts (SfChart)
8 Jul 202613 minutes to read
SfChart has a feature that allows you to edit an entire series or a single data point at run time by dragging the single point or the series as a whole.
Segment dragging
Segment Dragging defines the dragging a particular point or segment based on the series type. The segment dragging can be enabled using the EnableSegmentDragging property to true.
Line Series
<syncfusion:LineSeries
    Label="2010"
    EnableSegmentDragging="True"
    ItemsSource="{Binding Demands}"
    XBindingPath="Demand"
    YBindingPath="Year2010"
    Interior="#777777">
</syncfusion:LineSeries>
LineSeries series = new LineSeries()
{
ItemsSource = new ViewModel().Demands,
XBindingPath = "Demand",
YBindingPath = "Year2010",
EnableSegmentDragging = true,
Interior = new SolidColorBrush(Color.FromRgb(0x77, 0x77, 0x77)),
Label = "2010"
};
chart.Series.Add(series);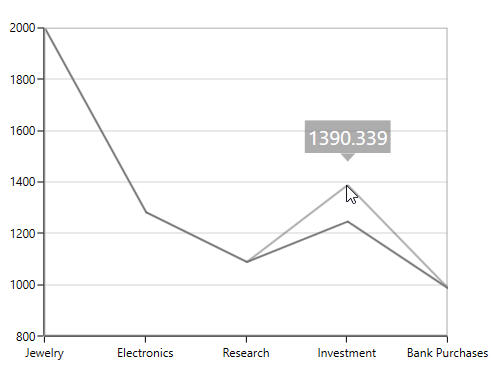
Column Series
<syncfusion:ColumnSeries
    Label="2011"
    EnableDragTooltip="True"
    EnableSegmentDragging="True"
    ItemsSource="{Binding Demands}"
    XBindingPath="Demand"
    YBindingPath="Year2010"
    Interior="#777777">
</syncfusion:ColumnSeries>
ColumnSeries series = new ColumnSeries()
{
ItemsSource = new ViewModel().Demands,
XBindingPath = "Demand",
YBindingPath = "Year2010",
EnableSegmentDragging = true,
EnableDragTooltip = true,
Interior = new SolidColorBrush(Color.FromRgb(0x77, 0x77, 0x77)),
Label = "2010"
};
chart.Series.Add(series);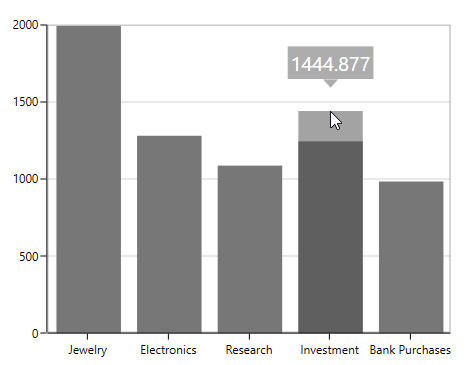
Scatter Series
This series supports dragging in both the x and y co-ordinates. The dragging co-ordinates can be set by using the enum property DragDirection.
<syncfusion:ScatterSeries
    ItemsSource="{Binding Data}"
    XBindingPath="Index"
    YBindingPath="Value"
    Interior="#777777"
    EnableSegmentDragging="True"
    DragDirection="XY">
</syncfusion:ScatterSeries>
ScatterSeries series = new ScatterSeries()
{
ItemsSource = new ViewModel().Data,
XBindingPath = "Index",
YBindingPath = "Value",
Interior = new SolidColorBrush(Color.FromRgb(0x77, 0x77, 0x77)),
EnableSegmentDragging = true,
DragDirection = DragType.XY
};
chart.Series.Add(series);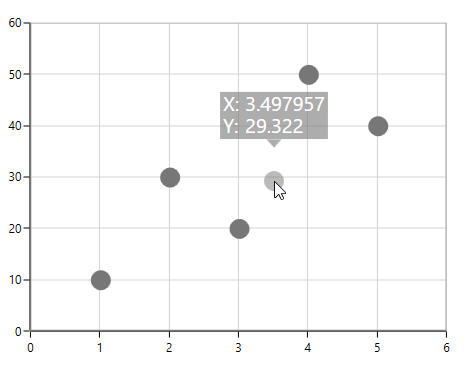
NOTE
By default, the DragDirection of the scatter series is XY.
Series dragging
SfChart provides support to drag the LineSeries and SplineSeries. This allows the series to move to a new position by dragging. To enable the series dragging, you have to set EnableSeriesDragging property to true.
The following code snippet explains the series dragging feature in LineSeries.
<syncfusion:LineSeries
    Label="2010"
    EnableDragTooltip="True"
    EnableSeriesDragging="True"
    ItemsSource="{Binding Demands}"
    XBindingPath="Demand"
    YBindingPath="Year2010"
    Interior="#777777">
</syncfusion:LineSeries>
LineSeries series = new LineSeries()
{
ItemsSource = new ViewModel().Demands,
XBindingPath = "Demand",
YBindingPath = "Year2010",
EnableSeriesDragging = true,
EnableDragTooltip = true,
Interior = new SolidColorBrush(Color.FromRgb(0x77, 0x77, 0x77)),
Label = "2010"
};
chart.Series.Add(series);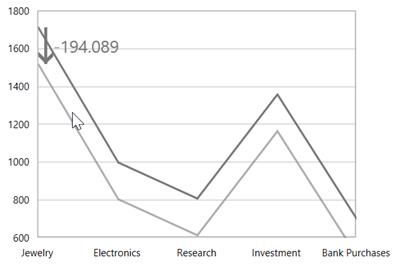
NOTE
In line and Spline Series, if segment and series dragging is enabled, the series dragging is having higher priority over segment dragging.
ToolTip for dragging
While the series or segment is dragged by default you can view the tooltip showing the new y value. To disable the tooltip while dragging you have to set the EnableDragToolTip as false.
<syncfusion:LineSeries
    Label="2010"
    EnableSegmentDragging="True"
    EnableDragTooltip="False"
    ItemsSource="{Binding Demands}"
    XBindingPath="Demand"
    YBindingPath="Year2010"
    Interior="#777777"
    Focusable="False">
</syncfusion:LineSeries>
LineSeries series = new LineSeries()
{
ItemsSource = new ViewModel().Demands,
XBindingPath = "Demand",
YBindingPath = "Year2010",
EnableSeriesDragging = true,
EnableDragTooltip = false,
Focusable = false,
Interior = new SolidColorBrush(Color.FromRgb(0x77, 0x77, 0x77)),
Label = "2010"
};
chart.Series.Add(series);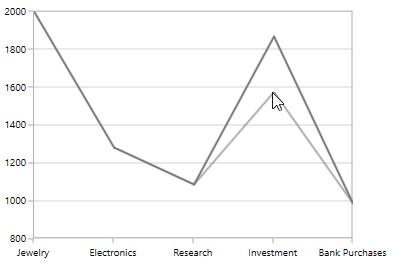
Drag Tooltip Template
DragTooltipTemplate property allows you to customize the default appearance of the tooltip while dragging.
<syncfusion:SfChart x:Name="chart">
    <syncfusion:SfChart.Resources>
        <DataTemplate x:Key="tooltipTemplate">
            <Border
                CornerRadius="4"
                BorderBrush="Black"
                BorderThickness="1"
                Background="CadetBlue"
                Margin="0,0,0,15">
                <TextBlock
                    Text="{Binding NewValue}"
                    FontSize="12"
                    Width="35"
                    Foreground="White"
                    Margin="2"/>
            </Border>
        </DataTemplate>
    </syncfusion:SfChart.Resources>

    <syncfusion:LineSeries
        Label="2010"
        EnableSegmentDragging="True"
        EnableDragTooltip="False"
        Focusable="False"
        ItemsSource="{Binding Demands}"
        XBindingPath="Demand"
        YBindingPath="Year2010"
        Interior="#777777"
        DragTooltipTemplate="{StaticResource tooltipTemplate}">
    </syncfusion:LineSeries>
</syncfusion:SfChart>
ColumnSeries series = new ColumnSeries()
{
ItemsSource = new ViewModel().Demands,
XBindingPath = "Demand",
YBindingPath = "Year2010",
Focusable = false,
EnableSegmentDragging = true,
DragTooltipTemplate = chart.Resources["tooltipTemplate"] as DataTemplate,
Interior = new SolidColorBrush(Color.FromRgb(0x77, 0x77, 0x77))
};
chart.Series.Add(series);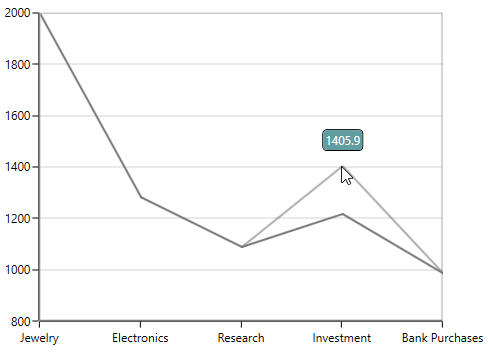
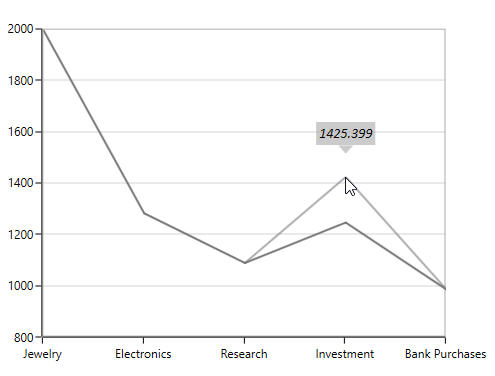
Drag Tooltip Style
The dragging tooltip can be customized by using the DragTooltipStyle property of the series.
The following are the API’s in ChartDragTooltipStyle.
FontFamily – Gets or sets the font family for dragging tooltip text.
FontSize – Gets or sets the font size for dragging tooltip text.
FontStyle – Gets or sets the font style for dragging tooltip text.
Foreground – Gets or sets the brush for dragging tooltip text.
Background – Gets or sets the background brush for dragging tooltip.
<syncfusion:LineSeries.DragTooltipStyle>
    <syncfusion:ChartDragTooltipStyle
        FontFamily="Calibri"
        FontSize="14"
        FontStyle="Italic"
        Background="DarkGray"
        Foreground="Black"/>
</syncfusion:LineSeries.DragTooltipStyle>series.DragTooltipStyle = new ChartDragTooltipStyle()
{
FontFamily = new FontFamily("Calibri"),
FontSize = 14,
FontStyle = FontStyles.Italic,
Background = new SolidColorBrush(Colors.DarkGray),
Foreground = new SolidColorBrush(Colors.Black)
};
Rounding Off the Dragged Value
To round off the dragged values, you have to set the SnapToPoint and RoundToDecimal properties. The following code snippet explains rounding the dragged y value to 2 decimal digits.
<syncfusion:SplineSeries
    ItemsSource="{Binding Demands}"
    XBindingPath="Demand"
    YBindingPath="Year2010"
    Interior="#777777"
    EnableSegmentDragging="True"
    UpdateSource="True"
    SnapToPoint="Round"
    RoundToDecimal="2">
</syncfusion:SplineSeries>
SplineSeries series = new SplineSeries()
{
ItemsSource = new ViewModel().Demands,
XBindingPath = "Demand",
YBindingPath = "Year2010",
EnableSegmentDragging = true,
UpdateSource = true,
RoundToDecimal = 2,
SnapToPoint = SnapToPoint.Round,
Interior = new SolidColorBrush(Color.FromRgb(0x77, 0x77, 0x77))
};
chart.Series.Add(series);Updating the Dragged Values to the Source
When dragging the series or segment at run time, to update the underlying data based on the values you have to set the UpdateSource property to true as in the following code snippet.
<syncfusion:SplineSeries
    EnableSegmentDragging="True"
    UpdateSource="True"
    ItemsSource="{Binding Demands}"
    XBindingPath="Demand"
    YBindingPath="Year2010"
    Interior="#777777">
</syncfusion:SplineSeries>
SplineSeries series = new SplineSeries()
{
ItemsSource = new ViewModel().Demands,
XBindingPath = "Demand",
YBindingPath = "Year2010",
EnableSegmentDragging = true,
UpdateSource = true,
Interior = new SolidColorBrush(Color.FromRgb(0x77, 0x77, 0x77))
};
chart.Series.Add(series);Drag Cancel using KeyModifiers
While you are dragging you can set the KeyModifiers to cancel the drag by setting DragCancelKeyModifier property as in the below code snippet.
<syncfusion:SplineSeries
    EnableSegmentDragging="True"
    DragCancelKeyModifiers="Alt"
    UpdateSource="True"
    ItemsSource="{Binding Demands}"
    XBindingPath="Demand"
    YBindingPath="Year2010">
</syncfusion:SplineSeries>
SplineSeries series = new SplineSeries()
{
ItemsSource = new ViewModel().Demands,
XBindingPath = "Demand",
YBindingPath = "Year2010",
EnableSegmentDragging = true,
DragCancelKeyModifiers = ModifierKeys.Alt,
UpdateSource = true ,
Interior = new SolidColorBrush(Color.FromRgb(0x77, 0x77, 0x77))
};
chart.Series.Add(series);Events
Series with visual data editing has support for following events:
-
DragStart- Occurs when segment/series drag started. -
DragDelta- Occurs when segment/series dragging. -
DragEnd- Occurs when segment/series drag end. -
PreviewDragEnd- Occurs before drag end triggered. -
SegmentEnter- Occurs when mouse enters in segment.