Trackball in WPF Charts (SfChart)
8 Jul 202618 minutes to read
The ChartTrackBallBehavior allows you to track a data point closer to the cursor position. The x values are determined from the position of the vertical line in the axis and y values are determined from the points touching the vertical line in the series.
Adding TrackBall to the SfChart
You can create an instance ChartTrackBallBehavior and add it to the Behaviors collection.
<syncfusion:SfChart.Behaviors>
    <syncfusion:ChartTrackBallBehavior>
    </syncfusion:ChartTrackBallBehavior>
</syncfusion:SfChart.Behaviors>
SfChart chart = new SfChart();
ChartTrackBallBehavior behavior = new ChartTrackBallBehavior();
chart.Behaviors.Add(behavior);To view the TrackBall in the particular Axis, you have to enable the ShowTrackBallInfo property in that axis as in the following code snippet.
<syncfusion:SfChart.PrimaryAxis>
    <syncfusion:CategoryAxis ShowTrackBallInfo="True"/>
</syncfusion:SfChart.PrimaryAxis>
ChartTrackBallBehavior behavior = new ChartTrackBallBehavior();
chart.Behaviors.Add(behavior);
chart.PrimaryAxis = new CategoryAxis()
{
ShowTrackBallInfo = true
};The default appearance of the trackball in primary axis (CategoryAxis).
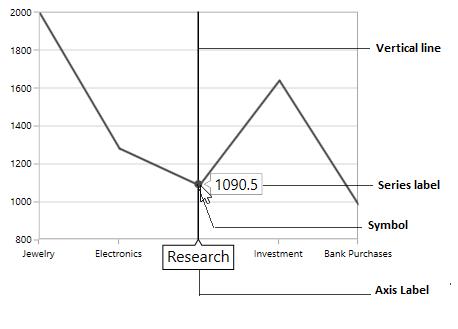
The Trackball is composed of the following parts:
-
Vertical Line
-
Symbol
-
Axis Label
-
Series Label
Vertical Line
The vertical line in the trackball is visible when you initialize the TrackBallBehavior.If you want to collapse the visibility of the trackball line, then you have to set ShowLine to false.
The following code snippet explains how to collapse the visibility of trackball line.
<syncfusion:SfChart.Behaviors>
    <syncfusion:ChartTrackBallBehavior ShowLine="False"/>
</syncfusion:SfChart.Behaviors>
ChartTrackBallBehavior behavior = new ChartTrackBallBehavior()
{
ShowLine = false
};
chart.Behaviors.Add(behavior);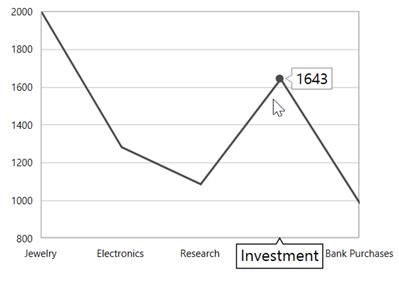
Customization of TrackBall Line
SfChart allows you to customize the appearance of trackball vertical line using the LineStyle property.
The following code snippet explains the customization of trackball line.
<syncfusion:SfChart x:Name="chart">
    <syncfusion:SfChart.Resources>
        <Style TargetType="Line" x:Key="lineStyle">
            <Setter Property="StrokeDashArray" Value="5,1,2"/>
            <Setter Property="Stroke" Value="Red"/>
            <Setter Property="StrokeThickness" Value="1.2"/>
        </Style>
    </syncfusion:SfChart.Resources>

    <syncfusion:SfChart.Behaviors>
        <syncfusion:ChartTrackBallBehavior LineStyle="{StaticResource lineStyle}"/>
    </syncfusion:SfChart.Behaviors>
</syncfusion:SfChart>
ChartTrackBallBehavior trackball = new ChartTrackBallBehavior()
{
LineStyle = chart.Resources["lineStyle"] as Style
};
chart.Behaviors.Add(trackball);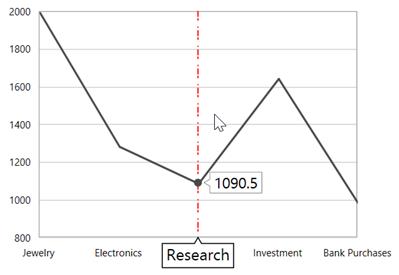
Symbol
By default, the trackball symbol is displayed as ellipse to change the default style of the symbol using ChartTrackBallStyle property.
<syncfusion:SfChart x:Name="chart">
    <syncfusion:SfChart.Resources>
        <Style TargetType="syncfusion:ChartTrackBallControl" x:Key="trackballStyle">
            <Setter Property="Background" Value="red"></Setter>
        </Style>
    </syncfusion:SfChart.Resources>

    <syncfusion:SfChart.Behaviors>
        <syncfusion:ChartTrackBallBehavior ChartTrackBallStyle="{StaticResource trackballStyle}"/>
    </syncfusion:SfChart.Behaviors>
</syncfusion:SfChart>
SfChart chart = new SfChart();
ChartTrackBallBehavior trackball = new ChartTrackBallBehavior()
{
ChartTrackBallStyle = chart.Resources["trackballStyle"] as Style
};
chart.Behaviors.Add(trackball);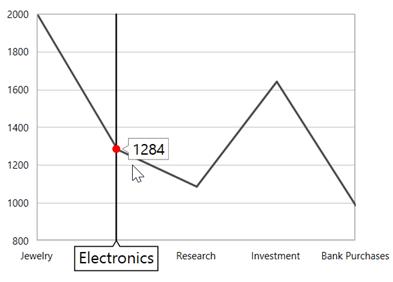
Axis Label
The axis label will be viewed when the ShowTrackBallInfo property is set to true. If you want to collapse the visibility of axis label in trackball then you have to set ShowTrackballInfo as false.
NOTE
By default the value of ShowTrackBallInfo is false.
Alignment of Axis Label
The alignment of the axis label while moving trackball can be defined using AxisLabelAlignment property.
Auto – Axis label is aligned in Near/Far positions based on the trackball movement.

Far - Axis label is positioned far from the position of trackball.

Near - Axis label is near to the position of trackball.

Center - Axis label is aligned to the center of the trackball. By default, the axis label will positioned in center.
Far
<syncfusion:SfChart.Behaviors>
     <syncfusion:ChartTrackBallBehavior AxisLabelAlignment="Far"/>
 </syncfusion:SfChart.Behaviors>
ChartTrackBallBehavior behavior = new ChartTrackBallBehavior()
{
AxisLabelAlignment = ChartAlignment.Far
};
chart.Behaviors.Add(behavior);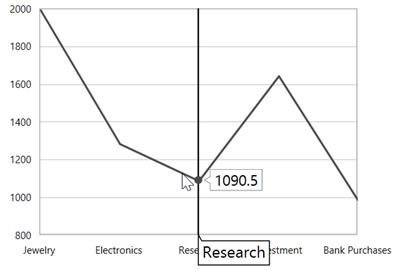
Near
<syncfusion:SfChart.Behaviors>
    <syncfusion:ChartTrackBallBehavior AxisLabelAlignment="Near"/>
</syncfusion:SfChart.Behaviors>
ChartTrackBallBehavior behavior = new ChartTrackBallBehavior()
{
AxisLabelAlignment = ChartAlignment.Near
};
chart.Behaviors.Add(behavior);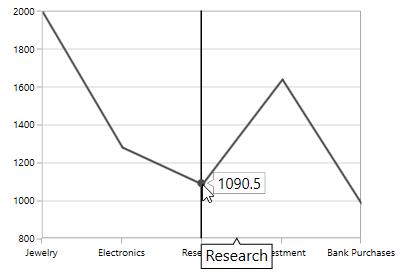
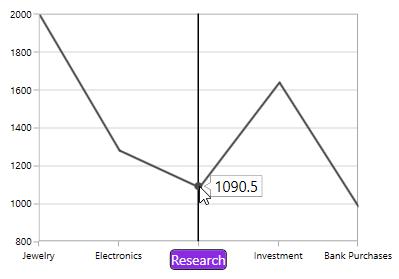
Customization of axis label
You can change the default appearance of the axis label in trackball using TrackballLabelTemplate property in ChartAxis as in the below code snippet.
<syncfusion:SfChart x:Name="chart">

    <syncfusion:SfChart.Resources>
        <DataTemplate x:Key="labelTemplate">
            <Border
                CornerRadius="4"
                BorderThickness="1"
                BorderBrush="Black"
                Background="BlueViolet"
                Margin="8">
                <TextBlock Foreground="White" Text="{Binding ValueX}"/>
            </Border>
        </DataTemplate>
    </syncfusion:SfChart.Resources>

    <syncfusion:SfChart.Behaviors>
        <syncfusion:ChartTrackBallBehavior/>
    </syncfusion:SfChart.Behaviors>

    <syncfusion:SfChart.PrimaryAxis>
        <syncfusion:CategoryAxis ShowTrackBallInfo="True" LabelTemplate="{StaticResource labelTemplate}"/>
    </syncfusion:SfChart.PrimaryAxis>

</syncfusion:SfChart>
SfChart chart = new SfChart();
chart.PrimaryAxis = new NumericalAxis()
{
ShowTrackBallInfo = true,
TrackBallLabelTemplate = chart.Resources["labelTemplate"] as DataTemplate
};
Series Label
When the trackball is hovered over, you can view the label is also displayed over the series in addition the axis label.
ShowTrackballInfo
The ShowTrackballInfo property of Cartesian Series allows user to enable or disable the trackball label for corresponding series. By default, ShowTrackballInfo property is true. The property can be set as shown in the below code example:
<syncfusion:SfChart>
            <syncfusion:SplineSeries Interior="#4a4a4a"/>
            <syncfusion:SplineSeries Interior="#7f7f7f" ShowTrackballInfo="False"/>
            <syncfusion:SplineSeries Interior="#bcbcbc"/>
 </syncfusion:SfChart>
SplineSeries series1 = new SplineSeries()
{
Interior = new SolidColorBrush(Color.FromArgb(0, 0x4a, 0x4a, 0x4a))
};
chart.Series.Add(series1);
SplineSeries series2 = new SplineSeries()
{
Interior = new SolidColorBrush(Color.FromArgb(0, 0x7f, 0x7f, 0x7f)),
ShowTrackballInfo = false
};
chart.Series.Add(series2);
SplineSeries series3 = new SplineSeries()
{
Interior = new SolidColorBrush(Color.FromArgb(0, 0xbc, 0xbc, 0xbc))
};
chart.Series.Add(series3);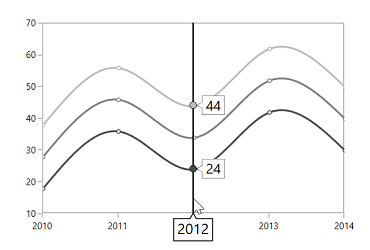
Alignment of Series Label
The trackball label displayed over the series can be aligned using the LabelHorizontalAlignment and LabelVerticalAlignment properties. By default, the series label will be horizontally aligned to the left and vertically to the top.
The following code snippet explains how to align the series label to the center of the trackball.
<syncfusion:SfChart.Behaviors>
    <syncfusion:ChartTrackBallBehavior LabelHorizontalAlignment="Center" LabelVerticalAlignment="Center"/>
</syncfusion:SfChart.Behaviors>
ChartTrackBallBehavior behavior = new ChartTrackBallBehavior()
{
LabelHorizontalAlignment = ChartAlignment.Center,
LabelVerticalAlignment = ChartAlignment.Center
};
chart.Behaviors.Add(behavior);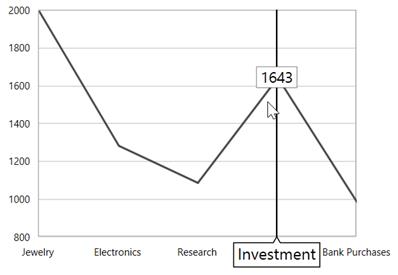
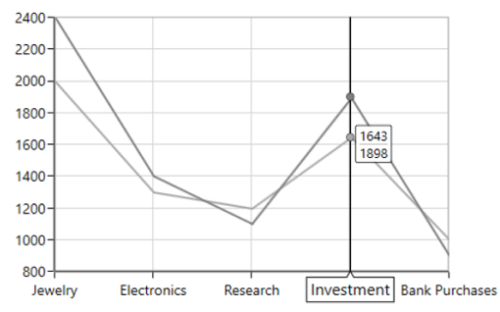
Label Display Mode
When there is a multiple series, by default, the trackball series label will be displayed only for the nearest point. If you want to display all the y values with respect to the x value then the LabelDisplayMode property is set to FloatAllPoints.
FloatAllPoints
<syncfusion:SfChart.Behaviors>
    <syncfusion:ChartTrackBallBehavior LabelDisplayMode="FloatAllPoints"/>
</syncfusion:SfChart.Behaviors>
ChartTrackBallBehavior behavior = new ChartTrackBallBehavior()
{
LabelDisplayMode = TrackballLabelDisplayMode.FloatAllPoints
};
chart.Behaviors.Add(behavior);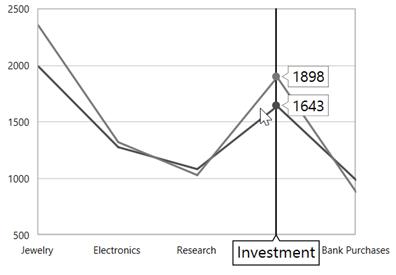
NearestPoint
<syncfusion:SfChart.Behaviors>
    <syncfusion:ChartTrackBallBehavior LabelDisplayMode="NearestPoint"/>
</syncfusion:SfChart.Behaviors>
ChartTrackBallBehavior behavior = new ChartTrackBallBehavior()
{
LabelDisplayMode = TrackballLabelDisplayMode.NearestPoint
};
chart.Behaviors.Add(behavior);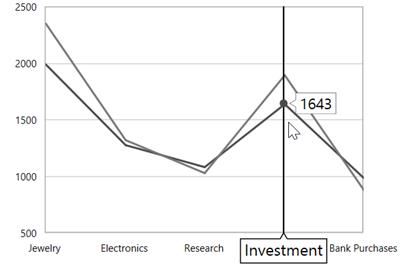
GroupAllPoints
ChartTrackBallBehavior supports grouping the multiple selected trackball points, and allows displaying the trackball points in a single trackball label. It can be achieved by setting the LabelDisplayMode property of ChartTrackBallBehavior to GroupAllPoints.
<syncfusion:SfChart.Behaviors>
    <syncfusion:ChartTrackBallBehavior LabelDisplayMode="GroupAllPoints"/>
</syncfusion:SfChart.Behaviors>
ChartTrackBallBehavior behavior = new ChartTrackBallBehavior()
{
LabelDisplayMode = TrackballLabelDisplayMode.GroupAllPoints
};
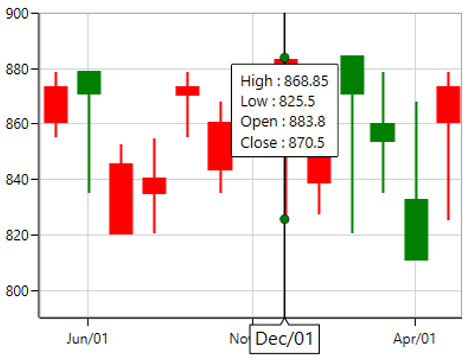
chart.Behaviors.Add(behavior);The following screenshot illustrates the trackball label for multiple series, when the LabelDisplayMode property value is GroupAllPoints.
The following screenshot illustrates the trackball label for financial series, when the LabelDisplayMode property value is GroupAllPoints.
TrackBall for Technical Indicators
In trackball label, the data point value of the technical indicator also can be displayed by enabling ShowTrackballInfo of technical indicator. It is shown in the following code example.
<chart:SfChart.Behaviors>
    <chart:ChartTrackBallBehavior/>
</chart:SfChart.Behaviors>

<chart:SfChart.TechnicalIndicators>
    <chart:AverageTrueRangeIndicator ShowTrackballInfo="True"/>
</chart:SfChart.TechnicalIndicators>
ChartTrackBallBehavior behavior = new ChartTrackBallBehavior();
chart.Behaviors.Add(behavior);
AverageTrueRangeIndicator average = new AverageTrueRangeIndicator();
average.ShowTrackballInfo = true;
chart.TechnicalIndicators.Add(average);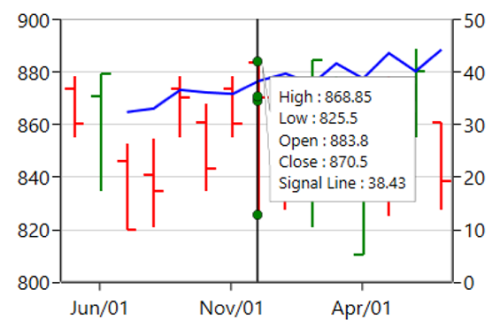
NOTE
By default,
ShowTrackballInfovalue of technical indicators is false.
TrackBall Label Template
TrackBallLabelTemplate property in ChartSeries allows you to customize the appearance of series label in trackball.
<syncfusion:SfChart x:Name="chart">
    <syncfusion:SfChart.Resources>
        <DataTemplate x:Key="labelTemplate">
            <Border CornerRadius="5"
                    BorderThickness="1"
                    BorderBrush="Black"
                    Background="BlueViolet"
                    Margin="8">
                <TextBlock Foreground="White" Text="{Binding ValueY}"/>
            </Border>
        </DataTemplate>
    </syncfusion:SfChart.Resources>

    <syncfusion:SfChart.Behaviors>
        <syncfusion:ChartTrackBallBehavior/>
    </syncfusion:SfChart.Behaviors>

    <syncfusion:ColumnSeries
        Label="2010"
        Interior="#4A4A4A"
        ItemsSource="{Binding Demands}"
        XBindingPath="Demand"
        YBindingPath="Year2010"
        TrackBallLabelTemplate="{StaticResource labelTemplate}"/>
</syncfusion:SfChart>
SfChart chart = new SfChart();
ChartTrackBallBehavior trackball = new ChartTrackBallBehavior();
chart.Behaviors.Add(trackball);
ColumnSeries series = new ColumnSeries()
{
ItemsSource = new ViewModel().Demands,
XBindingPath = "Demand",
YBindingPath = "Year2010",
TrackBallLabelTemplate = chart.Resources["labelTemplate"] as DataTemplate,
Interior = new SolidColorBrush(Color.FromRgb(0x4A, 0x4A, 0x4A))
};
chart.Series.Add(series);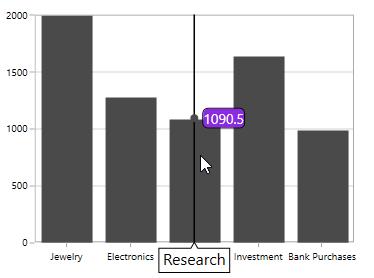
Applying Palette to the Series Label
Palette or interior color of the Series is applied to the series label by setting UseSeriesPalette to True as shown in the following code snippet.
<syncfusion:SfChart.Behaviors>
    <syncfusion:ChartTrackBallBehavior UseSeriesPalette="True">
    </syncfusion:ChartTrackBallBehavior>
</syncfusion:SfChart.Behaviors>
ChartTrackBallBehavior behavior = new ChartTrackBallBehavior()
{
UseSeriesPalette = true
};
chart.Behaviors.Add(behavior);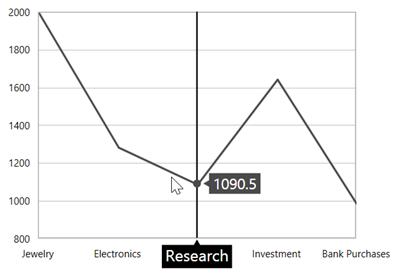
Events
The following events are available in ChartTrackBallBehavior:
PositionChanging
The PositionChanging event occurs when the trackball position is changing from current mouse position to new mouse position. This argument contains the following information.
-
Cancel- Gets or sets a value that indicates whether to show the trackball on new mouse pointer position. -
PointInfos- Gets or sets the currentChartPointInfo.
PositionChanged
The PositionChanged event occurs when the trackball position is changed from current mouse position to new mouse position. This argument contains the following information.
-
PreviousPointInfos- Gets or sets the previousChartPointInfo. -
CurrentPointInfos- Gets or sets the currentChartPointInfo.
The ChartPointInfo class contains the following properties to customize the appearance of trackball label:
-
Axis- Gets the associated axis in which the trackball is activated. -
BaseX- Gets the x-initial coordinate of the trackball label. -
BaseY- Gets the y-initial coordinate of the trackball label. -
BorderBrush- Gets or sets the border color of the trackball label. -
Close- Gets the close value of the trackball label when it is applicable. -
Foreground- Gets or sets the foreground color of the trackball label. -
High- Gets the high value of the trackball label when it is applicable. -
Interior- Gets or sets the interior color of the trackball label. -
Item- Gets the respective underlying object of the data in which the trackball is activated. -
Low- Gets the low value of the trackball label when it is applicable. -
LowerLine- Gets the y-value of the lower line in indicator. -
Median- Gets the median value when it is applicable. -
Open- Gets the open value of the trackball label when it is applicable. -
PolygonPoints- Gets the point collection to render trackball. -
Series- Gets the associated series in which the trackball is activated. -
SeriesValues- Gets the SeriesValues in which the trackball is activated. -
SignalLine- Gets the y-value of the signal line in indicator. -
UpperLine- Gets the y-value of the upper line in indicator. -
ValueX- Gets the x-value of the trackball label. -
ValueY- Gets the y-value of the trackball label. -
X- Gets the x-coordinate of the trackball label. -
Y- Gets the y-coordinate of the trackball label.
See also
How to synchronize the trackball in multiple WPF ChartsHow to add and customize multiple trackballs in WPF ChartHow to disable the trackball for a specific series in WPF SfChartHow to customize the trackball appearance in WPF ChartHow to show the trackball programmatically in WPF ChartHow to display trackball label or tooltip over chart annotationHow to apply label formatting to trackball labels in WPF Chart (SfChart)