Summary in JavaScript Grid
12 Sep 202324 minutes to read
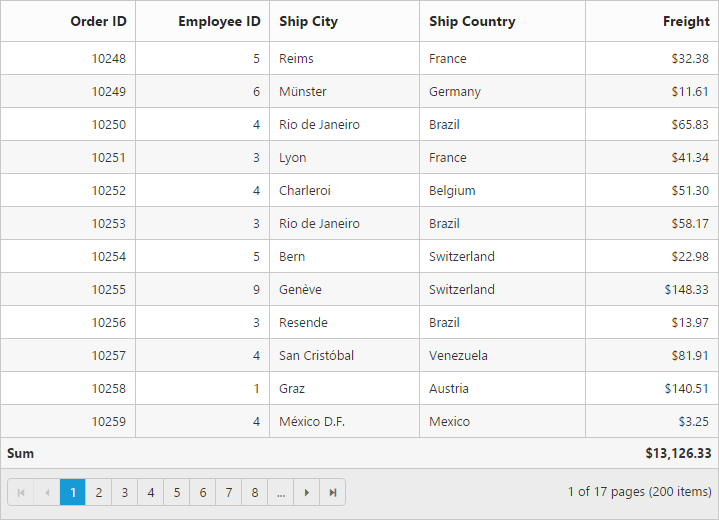
Summary rows visibility can be controlled by the showSummary property and it can be added to grid by using the summaryRows array property. The following code example describes the above behavior.
<div id="Grid"></div>
<script type="text/javascript">
  $("#Grid").ejGrid({
     // the datasource "window.gridData" is referred from jsondata.min.js
      dataSource: window.gridData,
      showSummary: true,
      summaryRows: [{
          title: "Sum",
          summaryColumns: [{
              summaryType: ej.Grid.SummaryType.Sum,
              displayColumn: "Freight",
              dataMember: "Freight",
              format: "{0:C2}"
          }]
      }],
      allowPaging: true,
      columns: [
          { field: "OrderID", headerText: "Order ID", isPrimaryKey: true, textAlign: ej.TextAlign.Right, width: 80 },
          {field: "EmployeeID",headerText: "Employee ID",editType: ej.Grid.EditingType.NumericEdit,textAlign: ej.TextAlign.Right,width: 80 },
          {field: "ShipCity",headerText: "Ship City",width: 90},
          {field: "ShipCountry",headerText: "Ship Country", width: 100},
          { field: "Freight", headerText: "Freight", textAlign: ej.TextAlign.Right, width: 80, format: "{0:C}" }
      ]
  });

</script>
NOTE
The
dataMemberdenotes the aggregation column whereas thedisplayColumndenotes the column in which aggregation value will be displayed.
Supported aggregates
Following are the supported list of the aggregates
- Sum
- Average
- Maximum
- Minimum
- False Count
- True Count
Sum, average, maximum and minimum
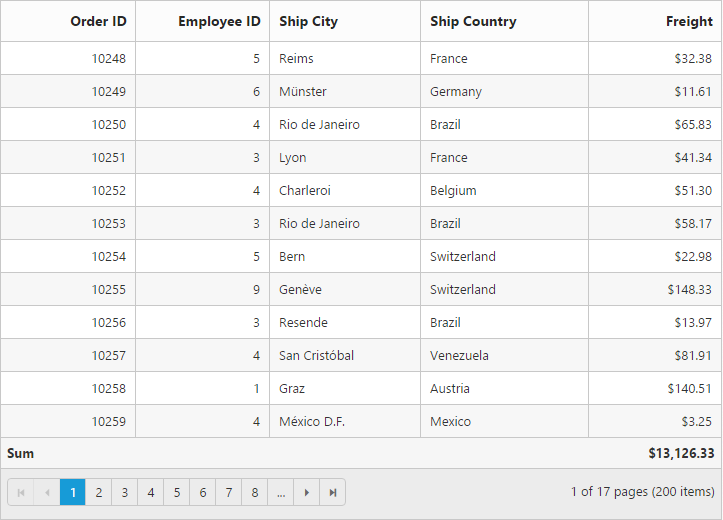
Summaries with the Sum, Average, Maximum and Minimum aggregate can be defined by using the summaryType in summaryColumns collections. These aggregate are used in the Number column.
<div id="Grid"></div>
<script type="text/javascript">
  $("#Grid").ejGrid({
      /// the datasource "window.gridData" is referred from jsondata.min.js
      dataSource: window.gridData,
      showSummary: true,
      summaryRows: [{
          title: "Sum",
          summaryColumns: [{
              summaryType: ej.Grid.SummaryType.Sum,
              displayColumn: "Freight",
              dataMember: "Freight",
              format: "{0:C2}"
          }]
      }, {
          title: "Average",
          summaryColumns: [{
              summaryType: ej.Grid.SummaryType.Average,
              displayColumn: "Freight",
              dataMember: "Freight",
              format: "{0:C2}"
          }]
      }, {
          title: "Maximum",
          summaryColumns: [{
              summaryType: ej.Grid.SummaryType.Maximum,
              displayColumn: "Freight",
              dataMember: "Freight",
              format: "{0:C2}"
          }]
      }, {
          title: "Minimum",
          summaryColumns: [{
              summaryType: ej.Grid.SummaryType.Minimum,
              displayColumn: "Freight",
              dataMember: "Freight",
              format: "{0:C2}"
          }]
      }],
      allowPaging: true,
      columns:
          [
              { field: "OrderID", headerText: "Order ID", isPrimaryKey: true, textAlign: ej.TextAlign.Right, width: 80 },
              { field: "EmployeeID", headerText: "Employee ID", editType: ej.Grid.EditingType.NumericEdit, textAlign: ej.TextAlign.Right, width: 80 },
              { field: "ShipCity", headerText: "Ship City", width: 90 },
              { field: "ShipCountry", headerText: "Ship Country", width: 100 },
              { field: "Freight", headerText: "Freight", textAlign: ej.TextAlign.Right, width: 80, format: "{0:C}" }
          ]
  });
</script>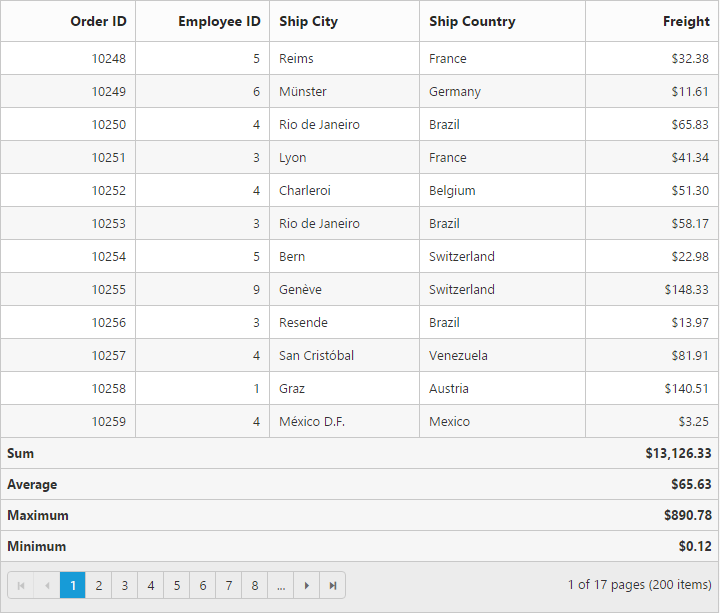
True and False count
Summaries with the True and False count aggregate can be defined by using the summaryType and summaryColumns collections. The True and False count aggregates are used for boolean columns.
<div id="Grid"></div>
<script type="text/javascript">
  $("#Grid").ejGrid({
      /// the datasource "window.gridData" is referred from jsondata.min.js
      dataSource: window.gridData,
      showSummary: true,
      summaryRows: [{
          title: "False Count",
          summaryColumns: [{
              summaryType: ej.Grid.SummaryType.FalseCount,
              displayColumn: "Verified",
              dataMember: "Verified"
          }]
      }, {
          title: "True Count",
          summaryColumns: [{
              summaryType: ej.Grid.SummaryType.TrueCount,
              displayColumn: "Verified",
              dataMember: "Verified"
          }]
      }],
      allowPaging: true,
      columns:
          [
              { field: "OrderID", headerText: "Order ID", isPrimaryKey: true, textAlign: ej.TextAlign.Right, width: 80 },
              { field: "EmployeeID", headerText: "Employee ID", editType: ej.Grid.EditingType.NumericEdit, textAlign: ej.TextAlign.Right, width: 80 },
              { field: "ShipCity", headerText: "Ship City", width: 90 },
              { field: "ShipCountry", headerText: "Ship Country", width: 100 },
              { field: "Verified", headerText: "Verified", width: 80 }
          ]
  });
</script>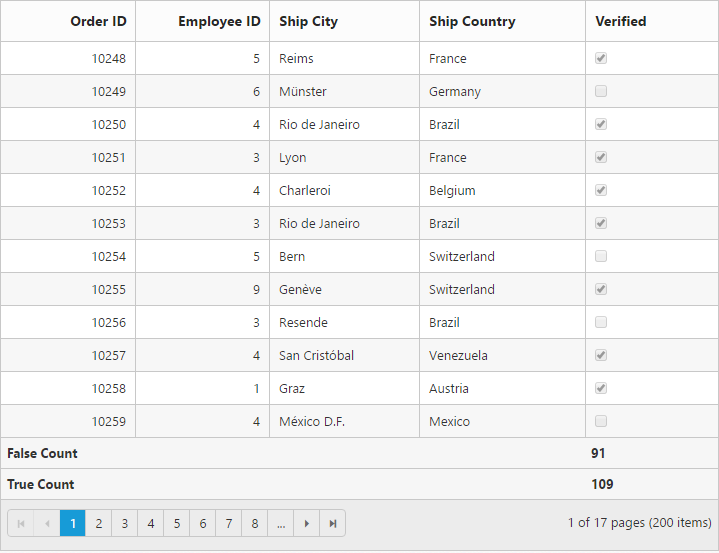
Column footer customization by external action
We can customize the columns footer element by external action using the following methods,
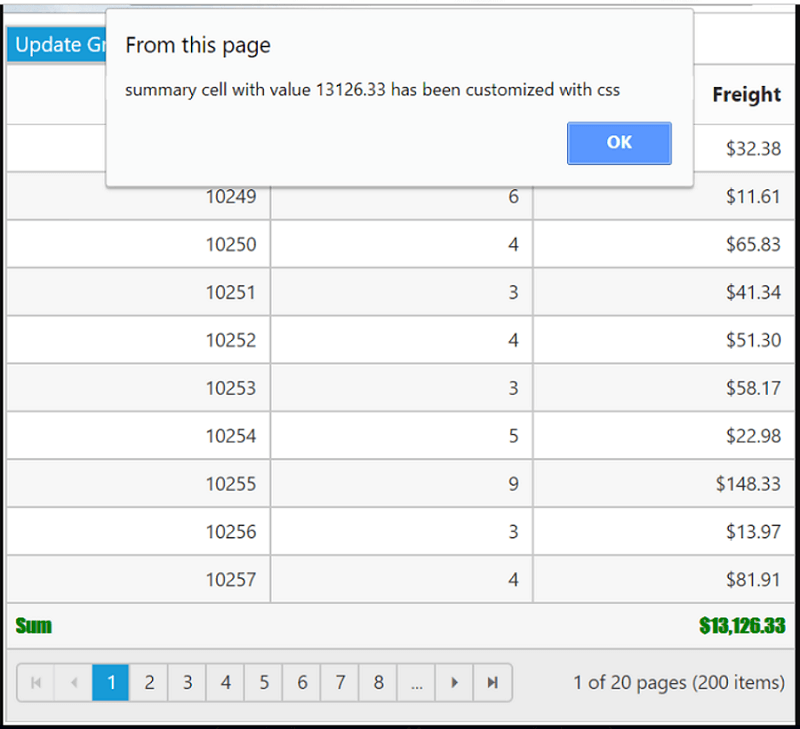
Here we have Changed the grid footer content, color and font-family to “green” and “fantasy” respectively by using the getFooterContent and getFooterTable method and also we have displayed the summary value summary value in the alert message by using getSummaryValues method.
The following code example describes the above behavior.
<input id="change">
<div id="Grid"></div>$("#change").ejButton({
text: "Update Grid header",
click: function(args){
var obj = $("#Grid").ejGrid("instance");
obj.getFooterContent().find("td.e-summaryrow").css("color","green");
obj.getFooterTable().css("font-family","fantasy");
var summaryCol = { summaryType: ej.Grid.SummaryType.Sum, displayColumn: "Freight", dataMember: "Freight" };// Get the calculated summary values of JSON data passed to it
var value = obj.getSummaryValues(summaryCol, window.gridData).toFixed(2);
alert( "summary cell with value " +value + " has been customized with css");
},
});
$(function () {
$("#Grid").ejGrid({
/// the datasource "window.gridData" is referred from jsondata.min.js
dataSource: window.gridData,
allowPaging: true,
showSummary: true,
pageSettings: { pageSize: 10 },
summaryRows: [
{ title: "Sum", summaryColumns: [{ summaryType: ej.Grid.SummaryType.Sum, displayColumn: "Freight", dataMember: "Freight", format: "{0:C2}" }] },
],
columns: [
{ field: "OrderID", headerText: "Order ID", isPrimaryKey: true, textAlign: ej.TextAlign.Right, width: 80 },
{ field: "EmployeeID", headerText: "Employee ID", editType: ej.Grid.EditingType.NumericEdit, textAlign: ej.TextAlign.Right, width: 80 },
{ field: "Freight", headerText: "Freight", textAlign: ej.TextAlign.Right, width: 80, format: "{0:C}" }
]
});
});The following output is displayed as a result of the above code example.
Custom summary
Custom summary can be used to create summary values based on your required custom logic and calculations. To enable custom summary, the summaryType should be custom and the customSummaryValue property need to define as function. In this property value function, you need to use the grid instance to access the model.dataSource and model.currentViewData. After the custom calculation, the returned value will be displayed in corresponding summary cell.
<div id="Grid"></div>
<script type="text/javascript">
  function currency(args,data) {
      //ej.sum is aggregate to add data of freight from datasource
      return ej.sum(data, "Freight");
  }
  $("#Grid").ejGrid({
      // the datasource "window.gridData" is referred from jsondata.min.js
      dataSource: window.gridData,
      showSummary: true,
      summaryRows: [{
          title: "Currency",
          summaryColumns: [{
              summaryType: ej.Grid.SummaryType.Custom,
              customSummaryValue: currency,
              displayColumn: "Freight",
              format: "{0:C2}"
          }]
      }],
      allowPaging: true,
      columns:
          [
              { field: "OrderID", headerText: "Order ID", textAlign: ej.TextAlign.Right, width: 70 },
              { field: "CustomerID", headerText: "Customer ID", textAlign: ej.TextAlign.Left, width: 70 },
              { field: "EmployeeID", headerText: "Employee ID", textAlign: ej.TextAlign.Right, width: 70 },
              { field: "ShipCity", headerText: "Ship City", textAlign: ej.TextAlign.Left, width: 70 },
              { field: "Freight",  headerText: "Freight",textAlign: ej.TextAlign.Right, width: 70,format: "{0:C2}"}]
  });
</script>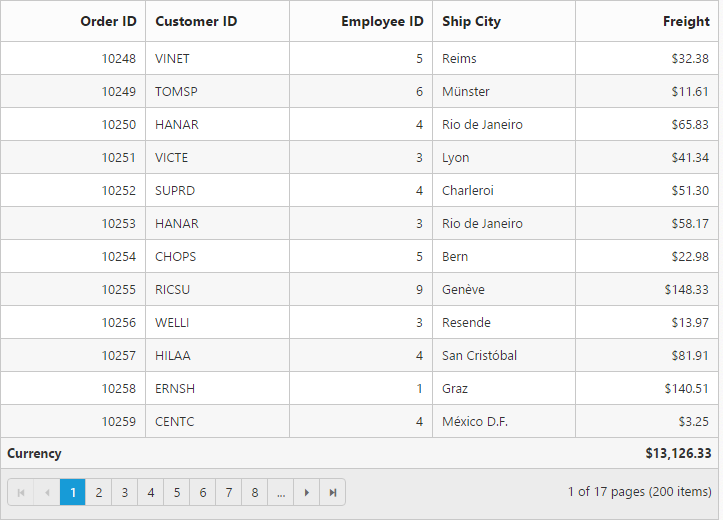
Summary values with prefix and suffix
Summaries with prefix and suffix can be added using the summaryColumns.prefix and summaryColumn.suffix summaryColumns.suffix.
<div id="Grid"></div>
<script type="text/javascript">
  $("#Grid").ejGrid({
     // the datasource "window.gridData" is referred from jsondata.min.js
      dataSource: window.gridData,
      showSummary: true,
      summaryRows: [{
          title: "Sum",
          summaryColumns: [{
              summaryType: ej.Grid.SummaryType.Sum,
              displayColumn: "Freight",
              dataMember: "Freight",
              format: "{0:C2}",
              prefix: "Summation = ",
              suffix: " in US"
          }]
      }],
      allowPaging: true,
      columns: [
          { field: "OrderID", headerText: "Order ID", isPrimaryKey: true, textAlign: ej.TextAlign.Right, width: 80 },
          {field: "EmployeeID",headerText: "Employee ID",editType: ej.Grid.EditingType.NumericEdit,textAlign: ej.TextAlign.Right,width: 80 },
          {field: "ShipCity",headerText: "Ship City",width: 90},
          {field: "ShipCountry",headerText: "Ship Country", width: 100},
          { field: "Freight", headerText: "Freight", textAlign: ej.TextAlign.Right, width: 80, format: "{0:C}" }
      ]
  });

</script>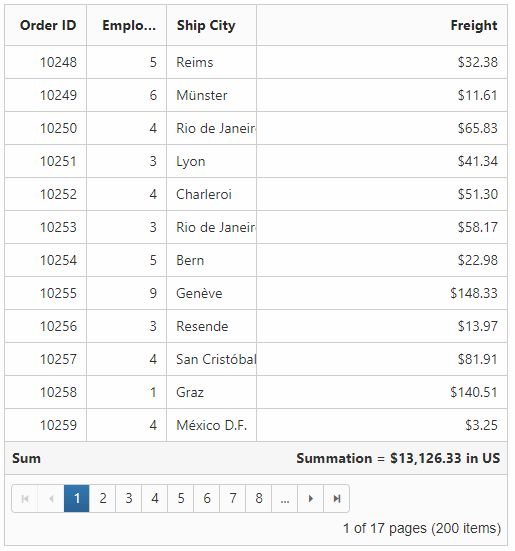
Title for summary
Title name of any summary value can be change using the title property of summaryColumns. Title displaying column can be altered by using the titleColumn.
<div id="Grid"></div>
<script type="text/javascript">
  $("#Grid").ejGrid({
     // the datasource "window.gridData" is referred from jsondata.min.js
      dataSource: window.gridData,
      showSummary: true,
      summaryRows: [{
          title: "Summation",
          titleColumn: "EmployeeID",
          summaryColumns: [{
              summaryType: ej.Grid.SummaryType.Sum,
              displayColumn: "Freight",
              dataMember: "Freight",
              format: "{0:C2}"
          }]
      }],
      allowPaging: true,
      columns: [
          { field: "OrderID", headerText: "Order ID", isPrimaryKey: true, textAlign: ej.TextAlign.Right, width: 80 },
          {field: "EmployeeID",headerText: "Employee ID",editType: ej.Grid.EditingType.NumericEdit,textAlign: ej.TextAlign.Right,width: 80 },
          {field: "ShipCity",headerText: "Ship City",width: 90},
          {field: "ShipCountry",headerText: "Ship Country", width: 100},
          { field: "Freight", headerText: "Freight", textAlign: ej.TextAlign.Right, width: 80, format: "{0:C}" }
      ]
  });

</script>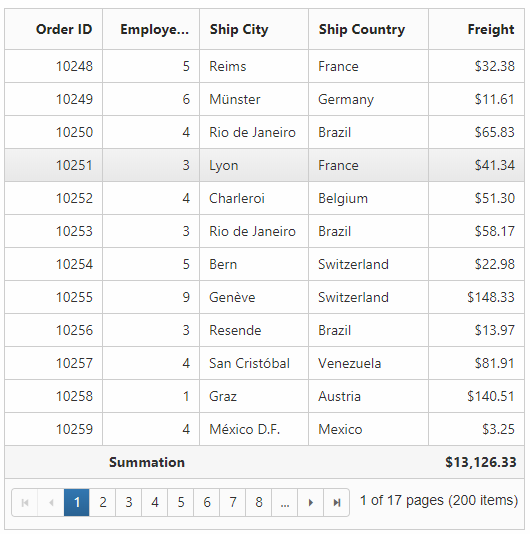
Group summary
Group summary is used to summarize values of a particular column based on group and it shows at bottom of the each group. To enable the group summary for particular group, you need to define the showTotalSummary as false.
<div id="Grid"></div>
<script type="text/javascript">
  $("#Grid").ejGrid({
      // the datasource "window.gridData" is referred from jsondata.min.js
      dataSource: window.gridData,
      showSummary: true,
      summaryRows: [{
          summaryColumns: [{
              summaryType: ej.Grid.SummaryType.Sum,
              displayColumn: "Freight",
              dataMember: "Freight",
              format: "{0:C2}",
              prefix: "Sum = "
          }],
          showTotalSummary: false
      }],
      allowPaging: true,
      allowSorting: true,
      allowGrouping: true,
      groupSettings: {
          groupedColumns: ["CustomerID"]
      },
      columns:
          [
              { field: "OrderID", headerText: "Order ID", width: 80, isPrimaryKey: true },
              { field: "CustomerID", headerText: "Customer ID", textAlign: ej.TextAlign.Right, width: 75 },
              { field: "ShipCity", headerText: 'Ship City', width: 150 },
              { field: "EmployeeID", headerText: "Employee ID", width: 75, textAlign: ej.TextAlign.Right },
              { field: "Freight", headerText: "Freight", width: 75, textAlign: ej.TextAlign.Right, format: "{0:C}" }
          ]
  });
</script>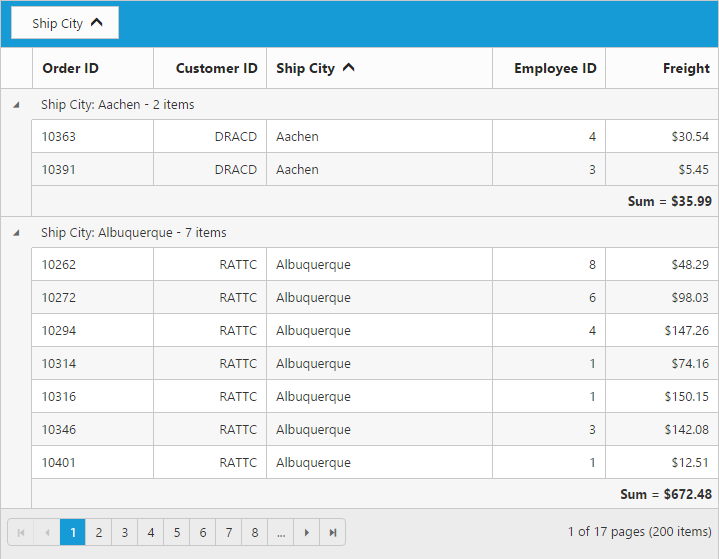
WARNING
Minimum one column should be grouped to show summary details.
Group caption summary
To show summaries in each group’s caption row, the particular summary row should have the showTotalSummary as false and the showCaptionSummary as true.
<div id="Grid"></div>
<script type="text/javascript">
  $("#Grid").ejGrid({
      dataSource: data,
      showSummary: true,
      summaryRows: [{
          showCaptionSummary: true,
          summaryColumns: [{
              summaryType: ej.Grid.SummaryType.Average,
              displayColumn: "Freight",
              dataMember: "Freight",
              format: "{0:C2}",
              prefix: "Average = "
          }],
          showTotalSummary: false
      }],
      allowPaging: true,
      allowGrouping: true,
      groupSettings: {
          groupedColumns: ["EmployeeID"]
      },
      columns:
          [
              { field: "OrderID", headerText: "Order ID", width: 80, isPrimaryKey: true },
              { field: "CustomerID", headerText: "Customer ID", textAlign: ej.TextAlign.Right, width: 75 },
              { field: "ShipCity", headerText: 'Ship City', width: 150 },
              { field: "EmployeeID", headerText: "Employee ID", width: 75, textAlign: ej.TextAlign.Right },
              { field: "Freight", headerText: "Freight", width: 75, textAlign: ej.TextAlign.Right, format: "{0:C}" }
          ]
  });
</script>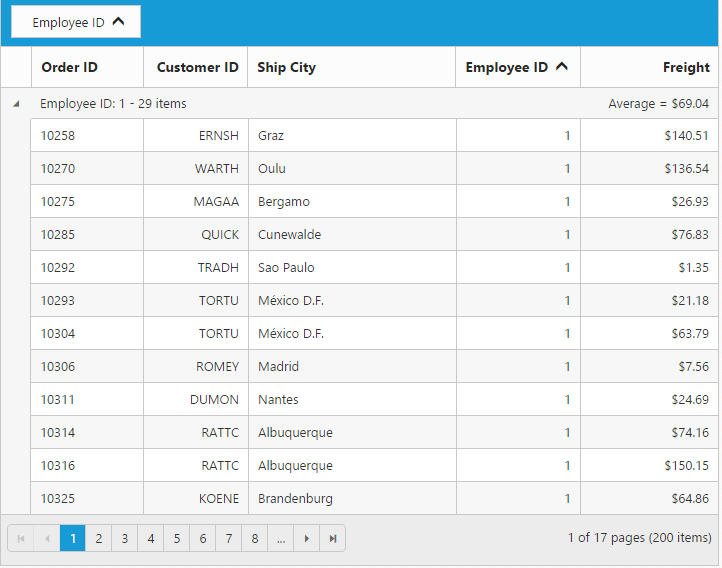
WARNING
Minimum one column should be grouped to show the summary details.
Summary template
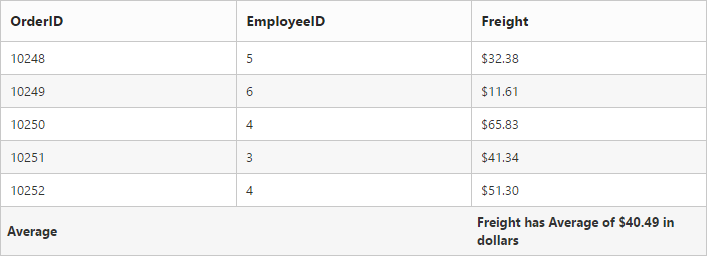
Using the template property of summaryColumns you can render any type of JsRender templates or customizing the summary value.
The following code example describes the above behavior.
<div id="Grid"></div>
<script id="templateData" type="text/x-jsrender">
     Freight has Average of {{:summaryValue"}} in  dollars
</script>$(function () {
$("#Grid").ejGrid({
dataSource: ej.DataManager(window.gridData).executeLocal(new ej.Query().take(5)),
showSummary: true,
summaryRows: [{
title: "Average",
summaryColumns: [{
summaryType: ej.Grid.SummaryType.Average,
displayColumn: "Freight",
dataMember: "Freight",
template: "#templateData",
format: "{0:C2}"
}]
}],
columns: [{ field: "OrderID" },{ field: "EmployeeID" },{ field: "Freight", format: "{0:C}" }]
});
});The following output is displayed as a result of the above code example.
Format
To format summary values, the format property needs to be assigned in the summaryColumns collection object. To know more about formatting options. Please refer to the globalize.js
<div id="Grid"></div>
<script type="text/javascript">
  $("#Grid").ejGrid({
      /// the datasource "window.gridData" is referred from jsondata.min.js
      dataSource: window.gridData,
      showSummary: true,
      summaryRows: [{
          title: "Sum",
          summaryColumns: [{
              summaryType: ej.Grid.SummaryType.Sum,
              displayColumn: "Freight",
              dataMember: "Freight",
              format: "{0:C2}"
          }]
      }],
      allowPaging: true,
      columns:
          [
              { field: "OrderID", headerText: "Order ID", isPrimaryKey: true, textAlign: ej.TextAlign.Right, width: 80 },
              { field: "EmployeeID", headerText: "Employee ID", textAlign: ej.TextAlign.Right, width: 80 },
              { field: "ShipCity", headerText: "Ship City", width: 90 },
              { field: "ShipCountry", headerText: "Ship Country", width: 100 },
              { field: "Freight", headerText: "Freight", textAlign: ej.TextAlign.Right, width: 80, format: "{0:C}" }
          ]
  });
</script>