Axis Title in .NET MAUI Cartesian Chart
10 Jul 20265 minutes to read
The Title property is used to set the title for the chart axis. The axis does not display a title by default.
NOTE
Prerequisite: Ensure that the required NuGet package is installed, the necessary namespaces are imported, and the SfCartesianChart control is properly configured in your application. For detailed setup and configuration instructions, refer to the Getting Started guide.
<chart:SfCartesianChart>
    <chart:SfCartesianChart.XAxes>
        <chart:CategoryAxis>
            <chart:CategoryAxis.Title>
                <chart:ChartAxisTitle Text="Category"/>
            </chart:CategoryAxis.Title>
        </chart:CategoryAxis>
    </chart:SfCartesianChart.XAxes>
    <chart:SfCartesianChart.YAxes>
        <chart:NumericalAxis>
            <chart:NumericalAxis.Title>
                <chart:ChartAxisTitle Text="Values"/>
            </chart:NumericalAxis.Title>
        </chart:NumericalAxis>
    </chart:SfCartesianChart.YAxes>
    <!-- code omitted for brevity -->
</chart:SfCartesianChart>
SfCartesianChart chart = new SfCartesianChart();
CategoryAxis primaryAxis = new CategoryAxis();
primaryAxis.Title = new ChartAxisTitle()
{
Text = "Category"
};
chart.XAxes.Add(primaryAxis);
NumericalAxis secondaryAxis = new NumericalAxis();
secondaryAxis.Title = new ChartAxisTitle()
{
Text = "Values"
};
chart.YAxes.Add(secondaryAxis);
// code omitted for brevity
this.Content = chart;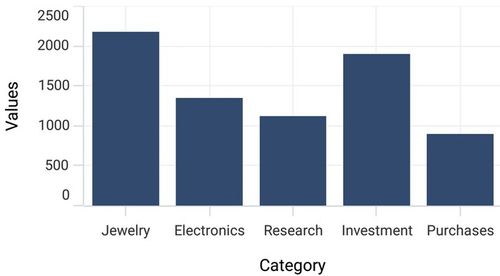
Customization
The Title property accepts a ChartAxisTitle object, which provides the following properties to customize the text and font of the axis title:
-
Text, of type
string, sets the title text for the axis. -
Background, of type
Brush, sets the background color of the title. -
CornerRadius, of type
Thickness, defines the rounded corners for the title. -
FontAttributes, of type
FontAttributes, sets the font style for the title. -
FontFamily, of type
string, sets the font family name for the title. -
FontSize, of type
double, sets the font size for the title. -
Margin, of type
Thickness, sets the margin of the title to customize its appearance. -
Stroke, of type
Brush, sets the border stroke color of the title. -
StrokeWidth, of type
double, sets the border thickness of the title. -
TextColor, of type
Color, sets the color of the title text.
The following example demonstrates how to customize the appearance of the axis title:
<chart:SfCartesianChart>
    <chart:SfCartesianChart.XAxes>
        <chart:CategoryAxis>
            <chart:CategoryAxis.Title>
                <chart:ChartAxisTitle Text="Category"
                                      FontAttributes="Bold"
                                      FontSize="16"
                                      TextColor="Blue"/>
            </chart:CategoryAxis.Title>
        </chart:CategoryAxis>
    </chart:SfCartesianChart.XAxes>
    <!-- code omitted for brevity -->
</chart:SfCartesianChart>
SfCartesianChart chart = new SfCartesianChart();
// code omitted for brevity
CategoryAxis primaryAxis = new CategoryAxis();
primaryAxis.Title = new ChartAxisTitle()
{
Text = "Category",
FontAttributes = FontAttributes.Bold,
FontSize = 16,
TextColor = Colors.Blue
};
chart.XAxes.Add(primaryAxis);
this.Content = chart;Label extent
The LabelExtent property, of type double and measured in pixels (px), allows you to set the gap between the axis labels and the title. The default value is 0. This is typically used to maintain a fixed gap between the axis labels and the title when the axis values change during live updates.
<chart:SfCartesianChart>
    <!-- code omitted for brevity -->
    <chart:SfCartesianChart.XAxes>
        <chart:CategoryAxis LabelExtent="60">
            <chart:CategoryAxis.Title>
                <chart:ChartAxisTitle Text="Category"/>
            </chart:CategoryAxis.Title>
        </chart:CategoryAxis>
    </chart:SfCartesianChart.XAxes>
    <!-- code omitted for brevity -->
</chart:SfCartesianChart>
SfCartesianChart chart = new SfCartesianChart();
CategoryAxis primaryAxis = new CategoryAxis();
primaryAxis.LabelExtent = 60;
primaryAxis.Title = new ChartAxisTitle()
{
Text = "Category"
};
chart.XAxes.Add(primaryAxis);
// code omitted for brevity
this.Content = chart;