Tick Lines in .NET MAUI Cartesian Chart
10 Jul 20265 minutes to read
Tick lines are the small lines which are drawn on the axis line representing the axis labels. Tick lines will be drawn outside of the axis by default.
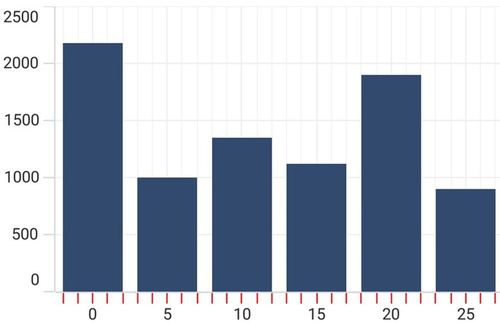
Minor tick lines can also be added to the axis by defining the MinorTicksPerInterval property, of type int with a default value of 0. This property is available on axes derived from RangeAxisBase and will add the minor tick lines to every interval based on the value.
NOTE
Prerequisite: Ensure that the required NuGet package is installed, the necessary namespaces are imported, and the SfCartesianChart control is properly configured in your application. For detailed setup and configuration instructions, refer to the Getting Started guide.
NOTE
For the category axis, minor tick lines are not applicable because it is rendered based on index positions.
<chart:SfCartesianChart>

    <chart:SfCartesianChart.XAxes>
        <chart:NumericalAxis MinorTicksPerInterval="4"/>
    </chart:SfCartesianChart.XAxes>

    <chart:SfCartesianChart.YAxes>
        <chart:NumericalAxis/>
    </chart:SfCartesianChart.YAxes>
    <!-- code omitted for brevity -->
</chart:SfCartesianChart>
SfCartesianChart chart = new SfCartesianChart();
NumericalAxis primaryAxis = new NumericalAxis()
{
MinorTicksPerInterval = 4
};
chart.XAxes.Add(primaryAxis);
NumericalAxis secondaryAxis = new NumericalAxis();
chart.YAxes.Add(secondaryAxis);
// code omitted for brevity
this.Content = chart;Positioning the ticks
The tick lines can be positioned inside or outside the chart area using the TickPosition property, of type AxisElementPosition, with the following values:
-
Outside- Draws the tick lines outside the chart area. -
Inside- Draws the tick lines inside the chart area.
The default value of the TickPosition property is AxisElementPosition.Outside.
<chart:SfCartesianChart>

    <chart:SfCartesianChart.XAxes>
        <chart:CategoryAxis/>
    </chart:SfCartesianChart.XAxes>

    <chart:SfCartesianChart.YAxes>
        <chart:NumericalAxis TickPosition="Inside"/>
    </chart:SfCartesianChart.YAxes>
    <!-- code omitted for brevity -->
</chart:SfCartesianChart>
SfCartesianChart chart = new SfCartesianChart();
CategoryAxis primaryAxis = new CategoryAxis();
NumericalAxis secondaryAxis = new NumericalAxis()
{
TickPosition = AxisElementPosition.Inside
};
chart.XAxes.Add(primaryAxis);
chart.YAxes.Add(secondaryAxis);
// code omitted for brevity
this.Content = chart;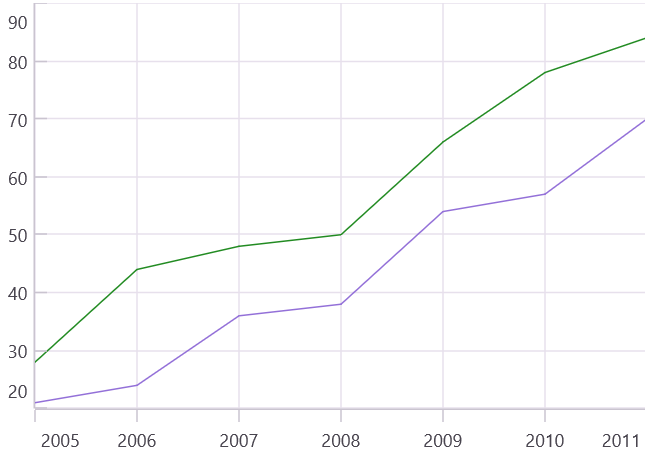
Customization
Both major and minor tick lines can be customized by using the MajorTickStyle and MinorTickStyle properties respectively. They provide options to change the StrokeWidth, TickSize, and Stroke of tick lines. By default, minor tick lines will not be visible; the MinorTicksPerInterval property must be set to a value greater than zero before the minor tick style is applied.
<chart:SfCartesianChart>

    <chart:SfCartesianChart.XAxes>
        <chart:NumericalAxis MinorTicksPerInterval="4">
            <chart:NumericalAxis.MajorTickStyle>
                <chart:ChartAxisTickStyle Stroke="Red"
                                          StrokeWidth="1"
                                          TickSize="10"/>
            </chart:NumericalAxis.MajorTickStyle>

            <chart:NumericalAxis.MinorTickStyle>
                <chart:ChartAxisTickStyle Stroke="Red" StrokeWidth="1"/>
            </chart:NumericalAxis.MinorTickStyle>
        </chart:NumericalAxis>
    </chart:SfCartesianChart.XAxes>

    <chart:SfCartesianChart.YAxes>
        <chart:NumericalAxis/>
    </chart:SfCartesianChart.YAxes>
    <!-- code omitted for brevity -->
</chart:SfCartesianChart>
SfCartesianChart chart = new SfCartesianChart();
NumericalAxis numerical = new NumericalAxis();
numerical.MinorTicksPerInterval = 4;
numerical.MajorTickStyle = new ChartAxisTickStyle()
{
StrokeWidth = 1,
Stroke = new SolidColorBrush(Colors.Red),
TickSize = 10,
};
numerical.MinorTickStyle = new ChartAxisTickStyle()
{
StrokeWidth = 1,
Stroke = new SolidColorBrush(Colors.Red),
};
chart.XAxes.Add(numerical);
NumericalAxis secondaryAxis = new NumericalAxis();
chart.YAxes.Add(secondaryAxis);
// code omitted for brevity
this.Content = chart;