Axis labels in .NET MAUI Cartesian Chart
10 Jul 20269 minutes to read
Axis labels display the units, measures, or category values of an axis to help users understand the data. They are generated based on the range and the values bound to XBindingPath or YBindingPath properties of the series.
NOTE
Prerequisite: Ensure that the required NuGet package is installed, the necessary namespaces are imported, and the Cartesian Chart control is properly configured in your application. For detailed setup and configuration instructions, refer to the Getting Started guide.
Positioning the labels
The LabelsPosition property is used to position the axis labels inside or outside the chart area. The AxisElementPosition enum provides the following values:
-
Inside— Positions labels inside the chart area. -
Outside(default) — Positions labels outside the chart area.
<chart:SfCartesianChart>
    <chart:SfCartesianChart.XAxes>
        <chart:CategoryAxis/>
    </chart:SfCartesianChart.XAxes>
    <chart:SfCartesianChart.YAxes>
        <chart:NumericalAxis LabelsPosition="Inside"/>
    </chart:SfCartesianChart.YAxes>
    <!-- code omitted for brevity -->
</chart:SfCartesianChart>
SfCartesianChart chart = new SfCartesianChart();
CategoryAxis primaryAxis = new CategoryAxis();
NumericalAxis secondaryAxis = new NumericalAxis()
{
LabelsPosition = AxisElementPosition.Inside
};
chart.XAxes.Add(primaryAxis);
chart.YAxes.Add(secondaryAxis);
// code omitted for brevity
this.Content = chart;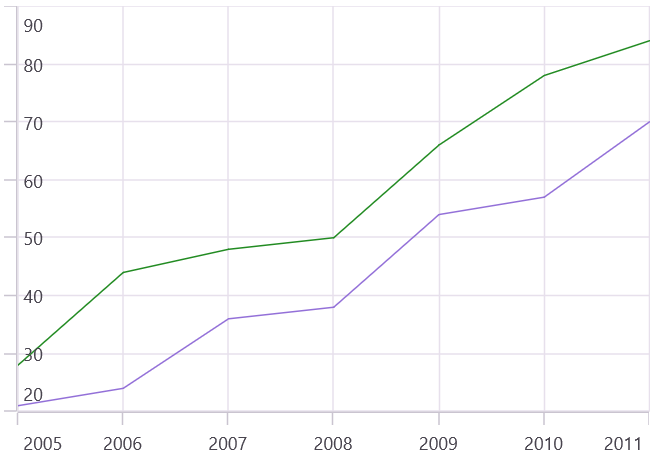
Label rotation
The LabelRotation property defines the rotation angle in degrees for the axis label content.
<chart:SfCartesianChart>
    <chart:SfCartesianChart.XAxes>
        <chart:CategoryAxis LabelRotation="90"/>
    </chart:SfCartesianChart.XAxes>
    <!-- code omitted for brevity -->
</chart:SfCartesianChart>
SfCartesianChart chart = new SfCartesianChart();
CategoryAxis primaryAxis = new CategoryAxis()
{
LabelRotation = 90
};
chart.XAxes.Add(primaryAxis);
// code omitted for brevity
this.Content = chart;Label customization
The LabelStyle property of the ChartAxis class provides options to customize axis labels. The ChartAxisLabelStyle class provides the following customization properties:
Appearance
-
Background— Sets the background color of the labels. -
Stroke— Sets the border stroke color of the labels. -
StrokeWidth— Sets the border thickness of the label. -
CornerRadius— Defines the rounded corners for labels. -
Margin— Sets the margin of the label.
Text Styling
-
FontAttributes— Sets the font style (Bold, Italic, None) for the label. -
FontFamily— Sets the font family name for the label. -
FontSize— Sets the font size for the label. -
TextColor— Sets the color for the label text.
Formatting and Alignment
-
LabelFormat— Sets numeric or date-time format for the axis label. -
LabelAlignment— Aligns labels at start, end, or center positions. -
MaxWidth— Sets the wrap width of the axis labels. -
WrappedLabelAlignment— Sets the horizontal rendering position of wrapped labels. Default isStart; other values areCenterandEnd.
Edge labels drawing mode
The EdgeLabelsDrawingMode property customizes the rendering position of edge labels. The EdgeLabelsDrawingMode enum provides the following values (default is Shift):
| Mode | Description |
|---|---|
| Center | Edge label appears at the center of its grid lines. |
| Fit | Edge labels are fitted within the chart area. |
| Hide | Edge labels are hidden. |
| Shift | Edge labels are shifted left or right to fit within the chart area. |
<chart:SfCartesianChart>
    <chart:SfCartesianChart.XAxes>
        <chart:DateTimeAxis EdgeLabelsDrawingMode="Center"/>
    </chart:SfCartesianChart.XAxes>
    <!-- code omitted for brevity -->
</chart:SfCartesianChart>
SfCartesianChart chart = new SfCartesianChart();
DateTimeAxis primaryAxis = new DateTimeAxis()
{
EdgeLabelsDrawingMode = EdgeLabelsDrawingMode.Center
};
chart.XAxes.Add(primaryAxis);
// code omitted for brevity
this.Content = chart;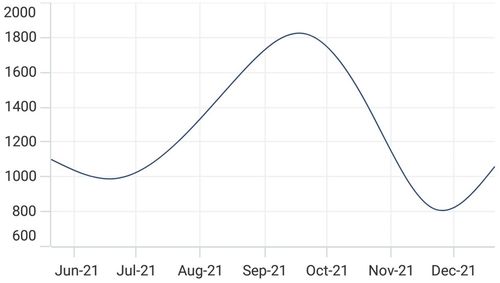
Edge labels visibility
The EdgeLabelsVisibilityMode property controls the visibility of edge labels. The EdgeLabelsVisibilityMode enum provides the following values:
-
Default(default) — Displays edge labels based on auto interval calculations. -
AlwaysVisible— Shows edge labels even when the chart is zoomed. -
Visible— Displays edge labels in normal state until zooming occurs.
Always visible
Use AlwaysVisible to show edge labels even when the chart area is zoomed:
<chart:SfCartesianChart>
    <chart:SfCartesianChart.XAxes>
        <chart:NumericalAxis EdgeLabelsVisibilityMode="AlwaysVisible"/>
    </chart:SfCartesianChart.XAxes>
    <!-- code omitted for brevity -->
</chart:SfCartesianChart>
SfCartesianChart chart = new SfCartesianChart();
NumericalAxis primaryAxis = new NumericalAxis()
{
EdgeLabelsVisibilityMode = EdgeLabelsVisibilityMode.AlwaysVisible
};
chart.XAxes.Add(primaryAxis);
// code omitted for brevity
this.Content = chart;Visible
Use Visible to display edge labels regardless of auto interval calculation, but only until zooming:
<chart:SfCartesianChart>
    <chart:SfCartesianChart.XAxes>
        <chart:NumericalAxis EdgeLabelsVisibilityMode="Visible"/>
    </chart:SfCartesianChart.XAxes>
    <!-- code omitted for brevity -->
</chart:SfCartesianChart>
SfCartesianChart chart = new SfCartesianChart();
NumericalAxis primaryAxis = new NumericalAxis()
{
EdgeLabelsVisibilityMode = EdgeLabelsVisibilityMode.Visible
};
chart.XAxes.Add(primaryAxis);
// code omitted for brevity
this.Content = chart;Smart axis labels
Axis labels may overlap based on chart dimensions and label size. The LabelsIntersectAction property prevents overlapping. The AxisLabelsIntersectAction enum provides the following values (default is Hide):
-
Hide— Hides overlapping labels. -
MultipleRows— Arranges overlapping labels in multiple rows. -
None— Displays all labels without any action. -
Wrap— Wraps label text to fit within specified width (requires MaxWidth property). Alignment can be controlled using WrappedLabelAlignment property.
<chart:SfCartesianChart>
    <chart:SfCartesianChart.XAxes>
        <chart:CategoryAxis LabelsIntersectAction="MultipleRows"/>
    </chart:SfCartesianChart.XAxes>
    <!-- code omitted for brevity -->
</chart:SfCartesianChart>
SfCartesianChart chart = new SfCartesianChart();
CategoryAxis primaryAxis = new CategoryAxis()
{
LabelsIntersectAction = AxisLabelsIntersectAction.MultipleRows
};
chart.XAxes.Add(primaryAxis);
// code omitted for brevity
this.Content = chart;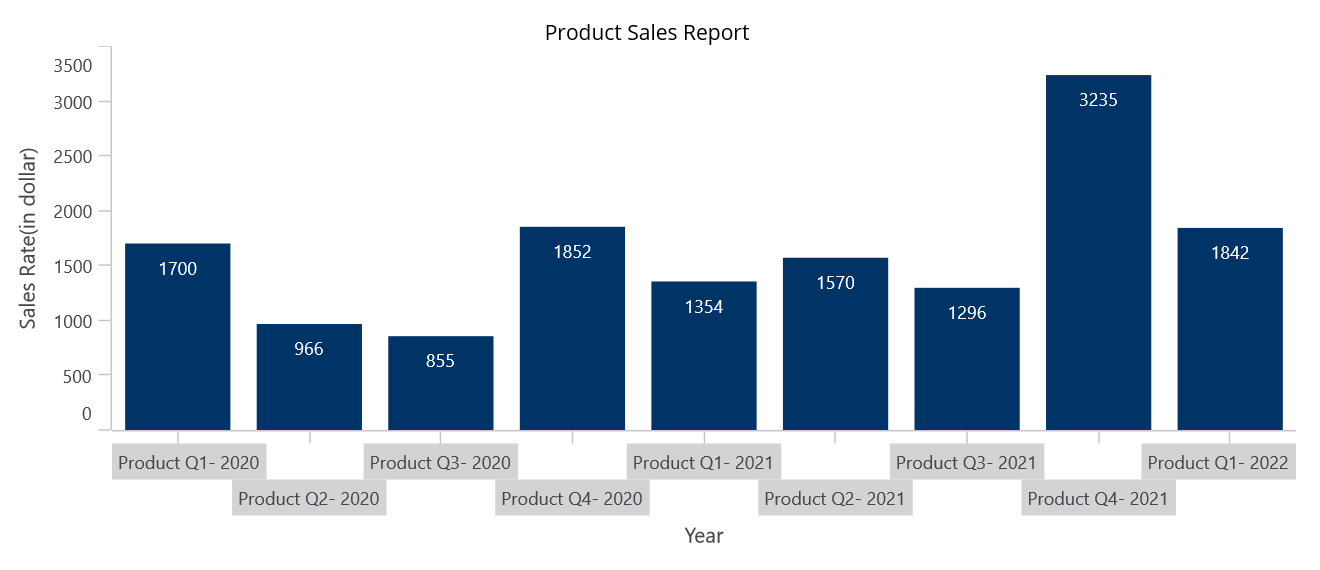
Maximum labels
The MaximumLabels property in ChartAxis controls the number of axis labels rendered per 100 pixels of axis. By default, 3 labels are displayed per 100 pixels. Set this property to override the default density.
NOTE
MaximumLabelsonly applies during automatic interval calculation and has no effect if theIntervalproperty is manually set on the axis.
<chart:SfCartesianChart>
    <chart:SfCartesianChart.YAxes>
        <chart:NumericalAxis MaximumLabels="5"/>
    </chart:SfCartesianChart.YAxes>
    <!-- code omitted for brevity -->
</chart:SfCartesianChart>
SfCartesianChart chart = new SfCartesianChart();
NumericalAxis axis = new()
{
MaximumLabels = 5
};
chart.YAxes.Add(axis);
// code omitted for brevity
this.Content = chart;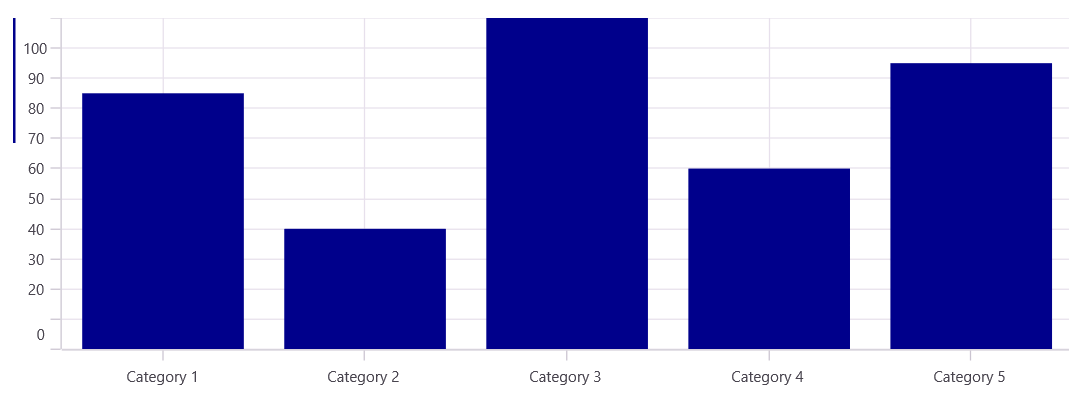
Events
AxisLabelTapped
The AxisLabelTapped event occurs when a user taps on an axis label. The AxisLabelTappedEventArgs class provides the following properties:
-
Axis— Gets the associated axis where the label was tapped. -
AxisLabel— Gets theChartAxisLabelobject containing details about the tapped label. -
Position— Gets the screen coordinates (X, Y) of the tap location in device-independent pixels.
<chart:SfCartesianChart AxisLabelTapped="OnAxisLabelTapped">
    <chart:SfCartesianChart.XAxes>
        <chart:CategoryAxis/>
    </chart:SfCartesianChart.XAxes>

    <chart:SfCartesianChart.YAxes>
        <chart:NumericalAxis/>
    </chart:SfCartesianChart.YAxes>

    <chart:ColumnSeries ItemsSource="{Binding Data}" XBindingPath="Category" YBindingPath="Value"/>
</chart:SfCartesianChart>
private void OnAxisLabelTapped(object sender, AxisLabelTappedEventArgs e)
{
var axis = e.Axis;
var axisLabel = e.AxisLabel;
var tapPosition = e.Position;
string message = $"Label: {axisLabel.Content}\n" +
$"Position: {axisLabel.Position:F2}\n" +
$"Axis: {axis.GetType().Name}\n" +
$"Tap Location: ({tapPosition.X:F0}, {tapPosition.Y:F0})";
DisplayAlertAsync("Axis Label Details", message, "OK");
}