Types of Axis in .NET MAUI Cartesian Chart
10 Jul 202624 minutes to read
Cartesian chart supports the following types of chart axis:
NOTE
Prerequisite: Ensure that the required NuGet package is installed, the necessary namespaces are imported, and the SfCartesianChart control is properly configured in your application. For detailed setup and configuration instructions, refer to the Getting Started guide.
Numerical Axis
NumericalAxis is used to plot numerical values on the chart. NumericalAxis can be defined for both XAxes and YAxes.
<chart:SfCartesianChart>
    <chart:SfCartesianChart.XAxes>
        <chart:NumericalAxis/>
    </chart:SfCartesianChart.XAxes>

    <chart:SfCartesianChart.YAxes>
        <chart:NumericalAxis/>
    </chart:SfCartesianChart.YAxes>

    <!-- code omitted for brevity -->

</chart:SfCartesianChart>
SfCartesianChart chart = new SfCartesianChart();
NumericalAxis primaryAxis = new NumericalAxis();
chart.XAxes.Add(primaryAxis);
NumericalAxis secondaryAxis = new NumericalAxis();
chart.YAxes.Add(secondaryAxis);
// code omitted for brevity
this.Content = chart;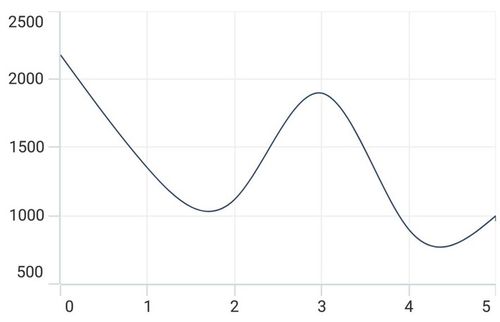
To customize the NumericalAxis in .NET MAUI Cartesian Charts, you can check the below video.
Interval
The axis interval can be customized by using the Interval property, of type double, with a default value of double.NaN. By default, the interval will be calculated based on the minimum and maximum values of the provided data.
<chart:SfCartesianChart>

    <chart:SfCartesianChart.XAxes>
        <chart:NumericalAxis Interval="10"/>
    </chart:SfCartesianChart.XAxes>

    <chart:SfCartesianChart.YAxes>
        <chart:NumericalAxis/>
    </chart:SfCartesianChart.YAxes>

    <!-- code omitted for brevity -->

</chart:SfCartesianChart>
SfCartesianChart chart = new SfCartesianChart();
NumericalAxis primaryAxis = new NumericalAxis()
{
Interval = 10
};
chart.XAxes.Add(primaryAxis);
NumericalAxis secondaryAxis = new NumericalAxis();
chart.YAxes.Add(secondaryAxis);
// code omitted for brevity
this.Content = chart;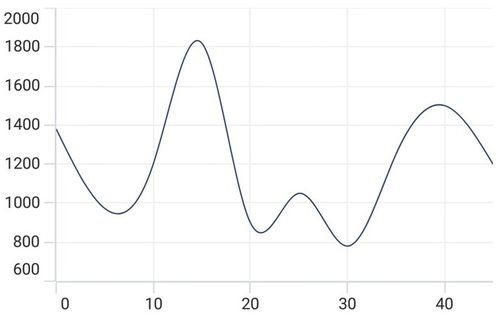
Customizing the range
Maximum and Minimum properties of the axis are used for setting the maximum and minimum values of the axis range respectively.
NOTE
If the minimum or maximum value is set, the other value is calculated by default internally.
<chart:SfCartesianChart>

    <chart:SfCartesianChart.YAxes>
      <chart:NumericalAxis Maximum="2750" Minimum="250" Interval="250"/>
    </chart:SfCartesianChart.YAxes>
    <!-- code omitted for brevity -->
</chart:SfCartesianChart>
SfCartesianChart chart = new SfCartesianChart();
NumericalAxis secondaryAxis = new NumericalAxis()
{
Maximum = 2750,
Minimum = 250,
Interval = 250
};
chart.YAxes.Add(secondaryAxis);
this.Content = chart;Category Axis
The CategoryAxis is an index-based axis that plots values based on the index of the data point collection. Data points are equally spaced.
<chart:SfCartesianChart>

    <chart:SfCartesianChart.XAxes>
        <chart:CategoryAxis/>
    </chart:SfCartesianChart.XAxes>

    <!-- code omitted for brevity -->

</chart:SfCartesianChart>
SfCartesianChart chart = new SfCartesianChart();
CategoryAxis primaryAxis = new CategoryAxis();
chart.XAxes.Add(primaryAxis);
// code omitted for brevity
this.Content = chart;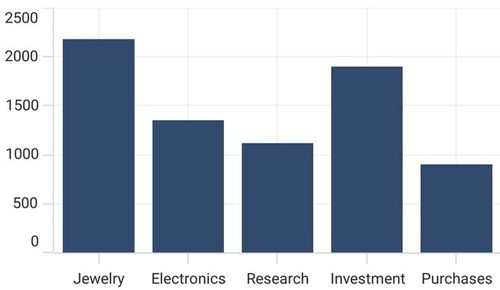
To customize the CategoryAxis in .NET MAUI Cartesian Charts, you can check the below video.
Label placement
The LabelPlacement property in CategoryAxis is used to place axis labels either on ticks or between ticks. The default value of LabelPlacement is OnTicks.
<chart:SfCartesianChart>

    <chart:SfCartesianChart.XAxes>
        <chart:CategoryAxis LabelPlacement="BetweenTicks"/>
    </chart:SfCartesianChart.XAxes>

    <!-- code omitted for brevity -->

</chart:SfCartesianChart>
SfCartesianChart chart = new SfCartesianChart();
CategoryAxis primaryAxis = new CategoryAxis()
{
LabelPlacement = LabelPlacement.BetweenTicks
};
chart.XAxes.Add(primaryAxis);
// code omitted for brevity
this.Content = chart;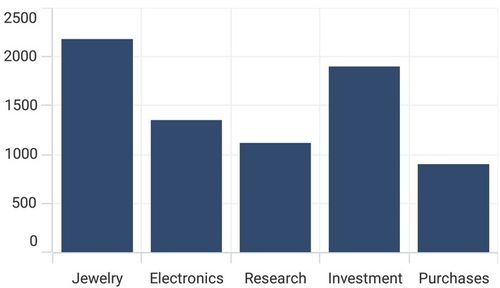
Interval
By default, the CategoryAxis labels are displayed at a fixed interval of 1. This can be customized by using the Interval property of the axis.
<chart:SfCartesianChart>

    <chart:SfCartesianChart.XAxes>
        <chart:CategoryAxis Interval="2"/>
    </chart:SfCartesianChart.XAxes>

    <!-- code omitted for brevity -->

</chart:SfCartesianChart>
SfCartesianChart chart = new SfCartesianChart();
CategoryAxis primaryAxis = new CategoryAxis()
{
Interval = 2
};
chart.XAxes.Add(primaryAxis);
// code omitted for brevity
this.Content = chart;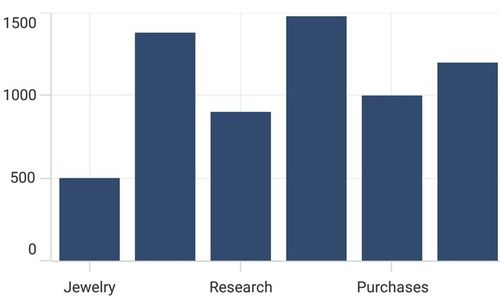
Indexed category axis
In Cartesian Charts, the ArrangeByIndex property is used to determine how the items in a category axis are arranged.
When ArrangeByIndex is set to true, the items in the category axis will be arranged according to their index values. Conversely, when set to false, the items will be arranged according to their values. By default, ArrangeByIndex is true.
The following code illustrates how to define the property ArrangeByIndex in chart.
<chart:SfCartesianChart>

    <chart:SfCartesianChart.XAxes>
        <chart:CategoryAxis ArrangeByIndex="False"/>
    </chart:SfCartesianChart.XAxes>

    <chart:SfCartesianChart.YAxes>
        <chart:NumericalAxis/>
    </chart:SfCartesianChart.YAxes>

    <chart:ColumnSeries ItemsSource="{Binding Data1}"
                        XBindingPath="Year"
                        YBindingPath="Value"/>

    <chart:ColumnSeries ItemsSource="{Binding Data2}"
                        XBindingPath="Year"
                        YBindingPath="Value"/>
</chart:SfCartesianChart>
SfCartesianChart chart = new SfCartesianChart();
CategoryAxis primaryAxis = new CategoryAxis()
{
ArrangeByIndex = false,
};
chart.XAxes.Add(primaryAxis);
NumericalAxis secondaryAxis = new NumericalAxis();
chart.YAxes.Add(secondaryAxis);
ColumnSeries series1 = new ColumnSeries();
series1.ItemsSource = new ViewModel().Data1;
series1.XBindingPath = "Year";
series1.YBindingPath = "Value";
ColumnSeries series2 = new ColumnSeries();
series2.ItemsSource = new ViewModel().Data2;
series2.XBindingPath = "Year";
series2.YBindingPath = "Value";
chart.Series.Add(series1);
chart.Series.Add(series2);
this.Content = chart;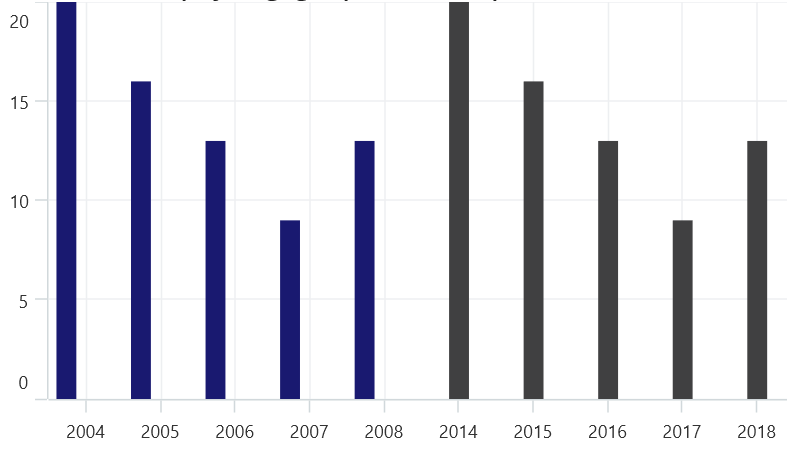
DateTime Axis
DateTimeAxis is used to plot DateTime values. The DateTimeAxis is widely used in financial charts such as stock market charts, where data is plotted daily.
<chart:SfCartesianChart>

    <chart:SfCartesianChart.XAxes>
        <chart:DateTimeAxis/>
    </chart:SfCartesianChart.XAxes>

    <!-- code omitted for brevity -->

</chart:SfCartesianChart>
SfCartesianChart chart = new SfCartesianChart();
DateTimeAxis primaryAxis = new DateTimeAxis();
chart.XAxes.Add(primaryAxis);
// code omitted for brevity
this.Content = chart;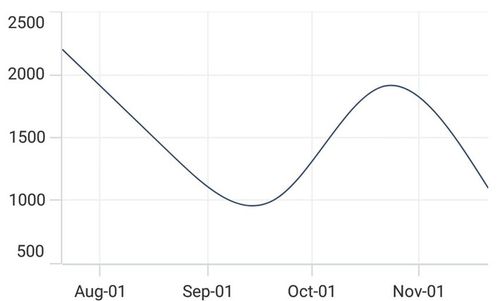
To customize the DateTimeAxis in .NET MAUI Cartesian Charts, you can check the below video.
Interval
In DateTimeAxis, intervals can be customized by using the Interval and IntervalType properties. For example, setting Interval as 6 and IntervalType as Months will consider 6 months as an interval. The default value of the IntervalType is DateTimeIntervalType.Auto.
<chart:SfCartesianChart>

    <chart:SfCartesianChart.XAxes>
        <chart:DateTimeAxis Interval="6" IntervalType="Months"/>
    </chart:SfCartesianChart.XAxes>

    <!-- code omitted for brevity -->

</chart:SfCartesianChart>
SfCartesianChart chart = new SfCartesianChart();
DateTimeAxis primaryAxis = new DateTimeAxis()
{
Interval = 6,
IntervalType = DateTimeIntervalType.Months
};
chart.XAxes.Add(primaryAxis);
// code omitted for brevity
this.Content = chart;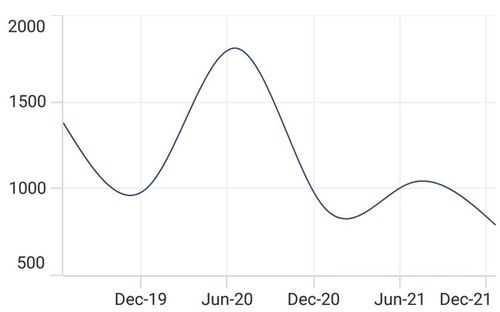
Customizing the range
Minimum and Maximum properties behave the same as in NumericalAxis; instead of numeric values, DateTime values must be used.
<chart:SfCartesianChart>

    <chart:SfCartesianChart.XAxes>
        <chart:DateTimeAxis Minimum="2021/05/10" Maximum="2021/11/01"/>
    </chart:SfCartesianChart.XAxes>

    <!-- code omitted for brevity -->

</chart:SfCartesianChart>
SfCartesianChart chart = new SfCartesianChart();
DateTimeAxis primaryAxis = new DateTimeAxis()
{
Minimum = new DateTime(2021, 05, 10),
Maximum = new DateTime(2021, 11, 01),
};
chart.XAxes.Add(primaryAxis);
// code omitted for brevity
this.Content = chart;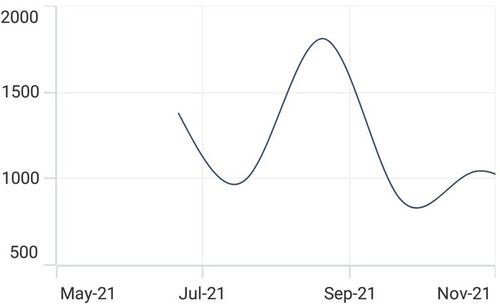
DateTimeCategory Axis
The DateTimeCategoryAxis is a specialized type of axis primarily used with financial series. Similar to the CategoryAxis, all data points are plotted with equal spacing, eliminating visual gaps for missing dates. The intervals and ranges for this axis are calculated similarly to the DateTimeAxis, even if the difference between two points exceeds a year.
<chart:SfCartesianChart>

    <chart:SfCartesianChart.XAxes>
        <chart:DateTimeCategoryAxis/>
    </chart:SfCartesianChart.XAxes>

    <!-- code omitted for brevity -->

</chart:SfCartesianChart>
SfCartesianChart chart = new SfCartesianChart();
DateTimeCategoryAxis primaryAxis = new DateTimeCategoryAxis();
chart.XAxes.Add(primaryAxis);
// code omitted for brevity
this.Content = chart;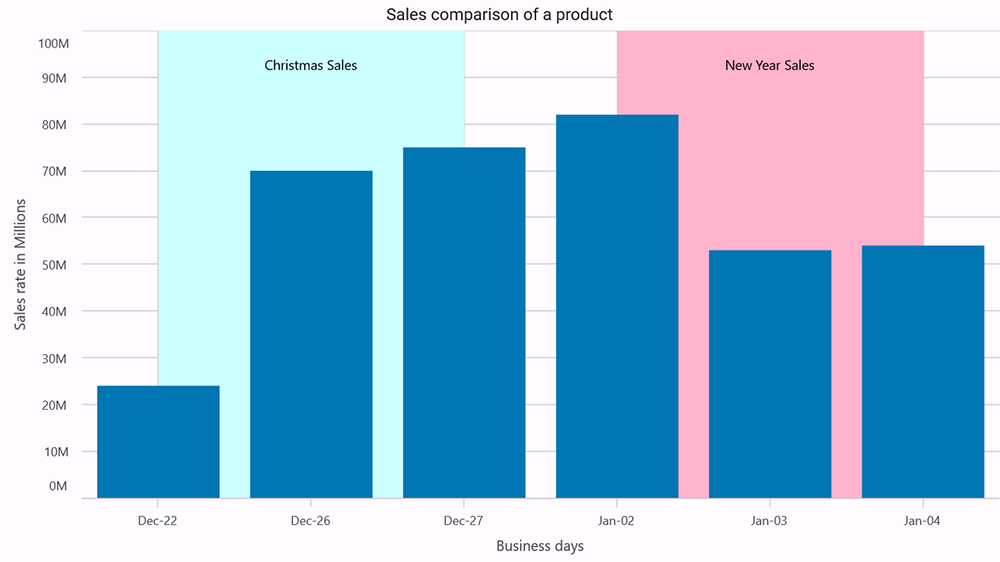
Interval
In DateTimeCategoryAxis, intervals can be customized by using the Interval and IntervalType properties, similar to DateTimeAxis. For example, setting Interval as 5 and IntervalType as Days will consider 5 days as an interval.
<chart:SfCartesianChart>

    <chart:SfCartesianChart.XAxes>
        <chart:DateTimeCategoryAxis Interval="5"
                                    IntervalType="Days"/>
    </chart:SfCartesianChart.XAxes>

    <!-- code omitted for brevity -->

</chart:SfCartesianChart>
SfCartesianChart chart = new SfCartesianChart();
DateTimeCategoryAxis primaryAxis = new DateTimeCategoryAxis()
{
Interval = 5,
IntervalType = DateTimeIntervalType.Days
};
chart.XAxes.Add(primaryAxis);
// code omitted for brevity
this.Content = chart;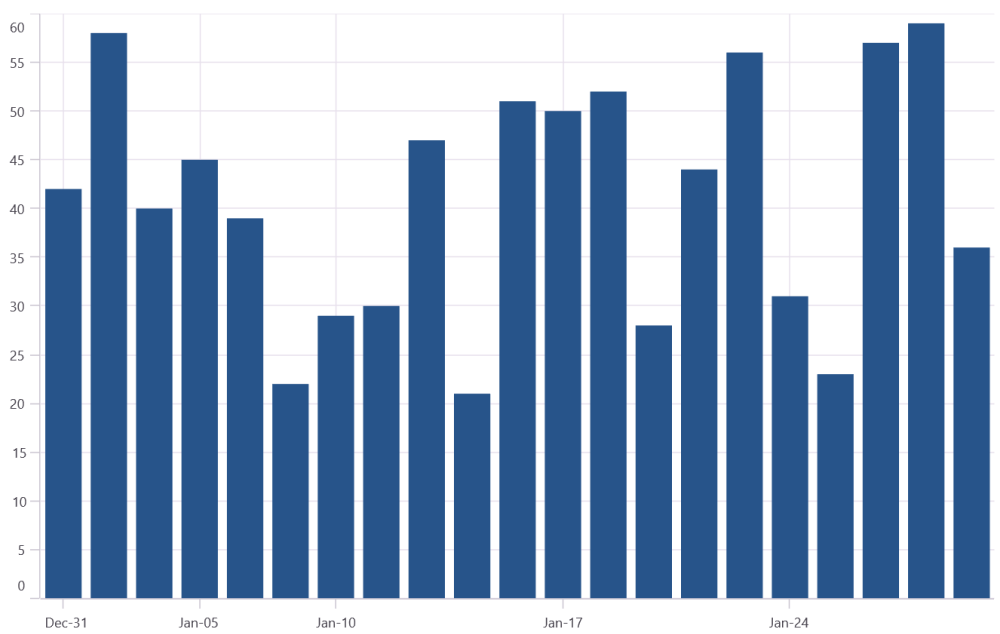
Logarithmic Axis
The LogarithmicAxis uses a logarithmic scale, and it is useful for visualizing data when the data range spans several orders of magnitude. It can be used either on the X-axis or the Y-axis.
<chart:SfCartesianChart>

    <chart:SfCartesianChart.YAxes>
        <chart:LogarithmicAxis/>
    </chart:SfCartesianChart.YAxes>

    <!-- code omitted for brevity -->

</chart:SfCartesianChart>
SfCartesianChart chart = new SfCartesianChart();
LogarithmicAxis secondaryAxis = new LogarithmicAxis();
chart.YAxes.Add(secondaryAxis);
// code omitted for brevity
this.Content = chart;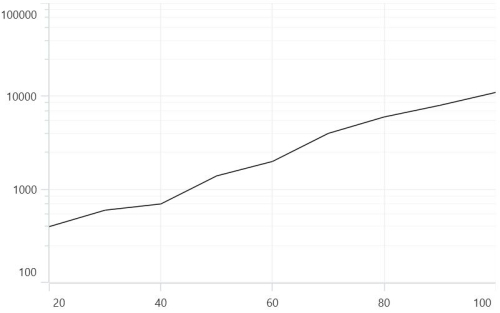
To customize the LogarithmicAxis in .NET MAUI Cartesian Charts, you can check the below video.
Interval
The axis interval can be customized using the Interval property of the axis. By default, the interval will be calculated based on the minimum and maximum values of the provided data. The default value of the interval is double.NaN.
<chart:SfCartesianChart>

    <chart:SfCartesianChart.YAxes>
        <chart:LogarithmicAxis Interval="2"/>
    </chart:SfCartesianChart.YAxes>

    <!-- code omitted for brevity -->

</chart:SfCartesianChart>
SfCartesianChart chart = new SfCartesianChart();
LogarithmicAxis secondaryAxis = new LogarithmicAxis()
{
Interval = 2
};
chart.YAxes.Add(secondaryAxis);
// code omitted for brevity
this.Content = chart;Customizing the range
To customize the range of the log axis, you can use the Minimum and Maximum properties of the LogarithmicAxis. By default, an optimal range will be calculated automatically based on the provided data.
<chart:SfCartesianChart>

    <chart:SfCartesianChart.YAxes>
        <chart:LogarithmicAxis Minimum="100" Maximum="10000"/>
    </chart:SfCartesianChart.YAxes>

    <!-- code omitted for brevity -->

</chart:SfCartesianChart>
SfCartesianChart chart = new SfCartesianChart();
LogarithmicAxis secondaryAxis = new LogarithmicAxis()
{
Minimum = 100,
Maximum = 10000
};
chart.YAxes.Add(secondaryAxis);
// code omitted for brevity
this.Content = chart;Customizing the base
The logarithmic axis base can be customized using the LogarithmicBase property, of type double, of the axis. By default, the base value is 10.
<chart:SfCartesianChart>

    <chart:SfCartesianChart.YAxes>
        <chart:LogarithmicAxis LogarithmicBase="5"/>
    </chart:SfCartesianChart.YAxes>

    <!-- code omitted for brevity -->

</chart:SfCartesianChart>
SfCartesianChart chart = new SfCartesianChart();
LogarithmicAxis secondaryAxis = new LogarithmicAxis()
{
LogarithmicBase = 5
};
chart.YAxes.Add(secondaryAxis);
// code omitted for brevity
this.Content = chart;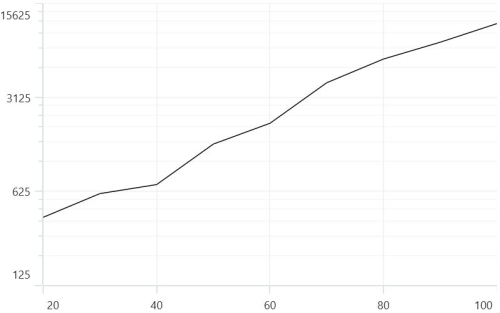
To customize the ChartAxis in .NET MAUI Cartesian Charts, you can check the below video.
Inverse axis
An axis can be inverted by using the IsInversed property. The default value of this property is false.
<chart:SfCartesianChart>

    <chart:SfCartesianChart.YAxes>
        <chart:NumericalAxis IsInversed="True"/>
    </chart:SfCartesianChart.YAxes>

    <!-- code omitted for brevity -->

</chart:SfCartesianChart>
SfCartesianChart chart = new SfCartesianChart();
NumericalAxis secondaryAxis = new NumericalAxis();
secondaryAxis.IsInversed = true;
chart.YAxes.Add(secondaryAxis);
// code omitted for brevity
this.Content = chart;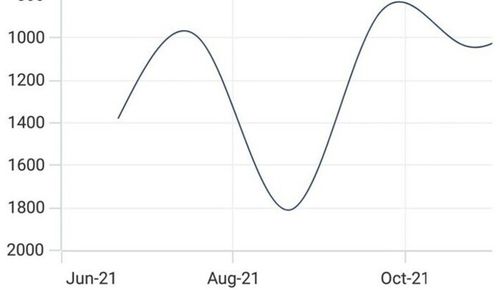
Axis visibility
Axis visibility can be controlled using the IsVisible property of the axis. The default value of the IsVisible property is true.
<chart:SfCartesianChart>

    <chart:SfCartesianChart.YAxes>
        <chart:NumericalAxis IsVisible="False"/>
    </chart:SfCartesianChart.YAxes>

    <!-- code omitted for brevity -->

</chart:SfCartesianChart>
SfCartesianChart chart = new SfCartesianChart();
NumericalAxis secondaryAxis = new NumericalAxis()
{
IsVisible = false
};
chart.YAxes.Add(secondaryAxis);
// code omitted for brevity
this.Content = chart;Multiple axes
Cartesian charts provide support to arrange multiple series inside the same chart area with a specified X-axis and Y-axis. There are two properties, XAxisName and YAxisName, in all the Cartesian series types, which are used to provide multiple axes support. These axes can be arranged in a stacking order or in a side-by-side pattern.
By default, the 0th index value of XAxes and YAxes is used to plot all the series.
<ContentPage xmlns="http://schemas.microsoft.com/dotnet/2021/maui"
             xmlns:x="http://schemas.microsoft.com/winfx/2009/xaml"
             xmlns:sys="clr-namespace:System;assembly=mscorlib"
             xmlns:chart="clr-namespace:Syncfusion.Maui.Charts;assembly=Syncfusion.Maui.Charts">

    <chart:SfCartesianChart>
        <chart:SfCartesianChart.XAxes>
            <chart:DateTimeAxis ShowMajorGridLines="False"/>
        </chart:SfCartesianChart.XAxes>

        <chart:SfCartesianChart.YAxes>
            <chart:NumericalAxis ShowMajorGridLines="False"/>
            <chart:NumericalAxis Name="series_YAxis" CrossesAt="{x:Static Member=sys:Double.MaxValue}" ShowMajorGridLines="False"/>
        </chart:SfCartesianChart.YAxes>

        <chart:ColumnSeries ItemsSource="{Binding Demands}"
                            XBindingPath="Demand"
                            YBindingPath="Year2011"
                            YAxisName="series_YAxis"/>
        <chart:SplineSeries ItemsSource="{Binding Demands}"
                            XBindingPath="Date"
                            YBindingPath="Year2011"/>
    </chart:SfCartesianChart>
</ContentPage>
SfCartesianChart chart = new SfCartesianChart();
DateTimeAxis primaryAxis = new DateTimeAxis()
{
ShowMajorGridLines = false
};
chart.XAxes.Add(primaryAxis);
NumericalAxis secondaryAxis = new NumericalAxis()
{
CrossesAt = double.MaxValue,
ShowMajorGridLines = false
};
secondaryAxis.Name = "series_YAxis";
chart.YAxes.Add(secondaryAxis);
NumericalAxis secondaryAxis1 = new NumericalAxis();
chart.YAxes.Add(secondaryAxis1);
ColumnSeries series1 = new ColumnSeries()
{
ItemsSource = new ViewModel().Demands,
XBindingPath = "Demand",
YBindingPath = "Year2011",
YAxisName = "series_YAxis"
};
SplineSeries series2 = new SplineSeries()
{
ItemsSource = new ViewModel().Demands,
XBindingPath = "Date",
YBindingPath = "Year2011"
};
chart.Series.Add(series1);
chart.Series.Add(series2);
this.Content = chart;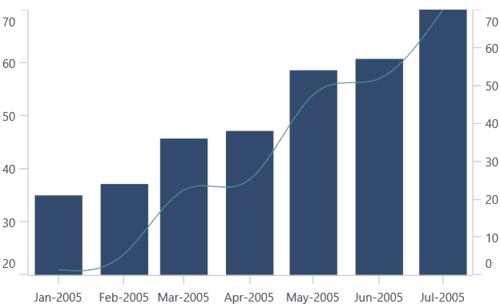
In the above image, the ColumnSeries is plotted based on additional axes of YAxes collection, and SplineSeries is plotted based on axis of the collection’s 0th index.
Axis crossing
The chart allows you to customize the origin; by default, the axis will be rendered with (0,0) as the origin in the X and Y axes. An axis can be positioned anywhere in the chart area by using the CrossesAt property. This property specifies where the horizontal axis crosses the vertical axis, and vice versa. The default value of the CrossesAt property is double.NaN.
<chart:SfCartesianChart>

    <chart:SfCartesianChart.XAxes>
        <chart:NumericalAxis CrossesAt="0"
                             Minimum="-8"
                             Maximum="8"
                             ShowMajorGridLines="False"/>
    </chart:SfCartesianChart.XAxes>

    <chart:SfCartesianChart.YAxes>
        <chart:NumericalAxis CrossesAt="0"
                             Minimum="-8"
                             Maximum="8"
                             ShowMajorGridLines="False"/>
    </chart:SfCartesianChart.YAxes>

</chart:SfCartesianChart>
SfCartesianChart chart = new SfCartesianChart();
NumericalAxis primaryAxis = new NumericalAxis();
primaryAxis.CrossesAt = 0;
primaryAxis.Minimum = -8;
primaryAxis.Maximum = 8;
primaryAxis.ShowMajorGridLines = false;
chart.XAxes.Add(primaryAxis);
NumericalAxis secondaryAxis = new NumericalAxis();
secondaryAxis.CrossesAt = 0;
secondaryAxis.Minimum = -8;
secondaryAxis.Maximum = 8;
secondaryAxis.ShowMajorGridLines = false;
chart.YAxes.Add(secondaryAxis);
this.Content = chart;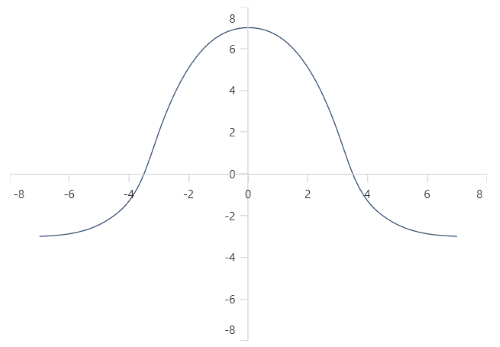
Positioning the axis elements while crossing
The RenderNextToCrossingValue property is used to determine whether the crossing axis should be placed at the crossing position or not. The default value of the RenderNextToCrossingValue property is true.
<chart:SfCartesianChart>

    <chart:SfCartesianChart.XAxes>
        <chart:NumericalAxis CrossesAt="0" RenderNextToCrossingValue="False"/>
    </chart:SfCartesianChart.XAxes>

    <chart:SfCartesianChart.YAxes>
        <chart:NumericalAxis CrossesAt="0"/>
    </chart:SfCartesianChart.YAxes>

</chart:SfCartesianChart>
SfCartesianChart chart = new SfCartesianChart();
NumericalAxis primaryAxis = new NumericalAxis();
primaryAxis.CrossesAt = 0;
primaryAxis.RenderNextToCrossingValue = false;
chart.XAxes.Add(primaryAxis);
NumericalAxis secondaryAxis = new NumericalAxis();
secondaryAxis.CrossesAt = 0;
chart.YAxes.Add(secondaryAxis);
this.Content = chart;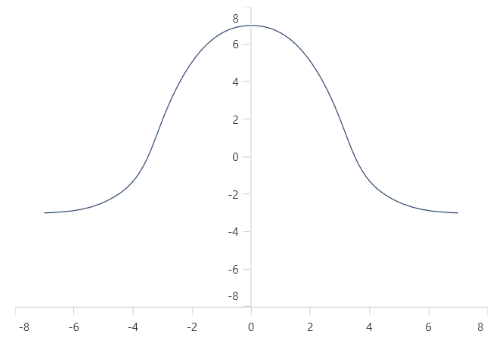
Crossing the date-time axis
For crossing on a date-time horizontal axis, a DateTime object should be provided as the value for the CrossesAt property of the vertical axis.
<chart:SfCartesianChart>

    <chart:SfCartesianChart.XAxes>
        <chart:DateTimeAxis />
    </chart:SfCartesianChart.XAxes>

    <chart:SfCartesianChart.YAxes>
        <chart:NumericalAxis CrossesAt="2021-01-01"/>
    </chart:SfCartesianChart.YAxes>

    <!-- code omitted for brevity -->

</chart:SfCartesianChart>
SfCartesianChart chart = new SfCartesianChart();
DateTimeAxis primaryAxis = new DateTimeAxis();
chart.XAxes.Add(primaryAxis);
NumericalAxis secondaryAxis = new NumericalAxis();
secondaryAxis.CrossesAt = new DateTime(2021, 01, 01);
chart.YAxes.Add(secondaryAxis);
// code omitted for brevity
this.Content = chart;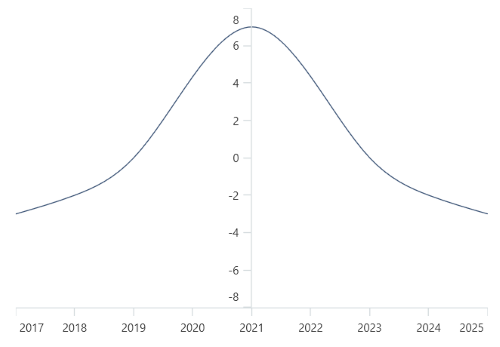
Opposite side axis with CrossesAt
The chart allows you to position the axis to the opposite position by setting the value as double.MaxValue for the CrossesAt property.
<chart:SfCartesianChart>

    <chart:SfCartesianChart.XAxes>
        <chart:NumericalAxis/>
    </chart:SfCartesianChart.XAxes>

    <chart:SfCartesianChart.YAxes>
        <chart:NumericalAxis CrossesAt="{x:Static sys:Double.MaxValue}"/>
    </chart:SfCartesianChart.YAxes>

    <!-- code omitted for brevity -->

</chart:SfCartesianChart>
SfCartesianChart chart = new SfCartesianChart();
NumericalAxis primaryAxis = new NumericalAxis();
chart.XAxes.Add(primaryAxis);
NumericalAxis secondaryAxis = new NumericalAxis();
secondaryAxis.CrossesAt = double.MaxValue;
chart.YAxes.Add(secondaryAxis);
// code omitted for brevity
this.Content = chart;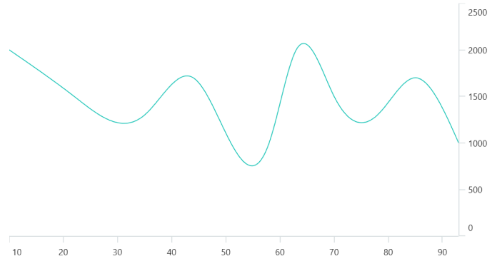
Events
ActualRangeChanged
The ActualRangeChanged event is triggered when the actual range of the axis is changed. The ActualRangeChangedEventArgs contains the following information:
- ActualMinimum - used to get the actual minimum value of the axis.
- ActualMaximum - used to get the actual maximum value of the axis.
NOTE
The actual range is changed by specifying the ZoomPosition and ZoomFactor properties or zooming the chart interactively.
SfCartesianChart chart = new SfCartesianChart();
NumericalAxis primaryAxis = new NumericalAxis();
primaryAxis.ActualRangeChanged += PrimaryAxis_ActualRangeChanged;
chart.XAxes.Add(primaryAxis);

private void PrimaryAxis_ActualRangeChanged(object sender, ActualRangeChangedEventArgs e)
{
    double minimum = (double)e.ActualMinimum;
    double maximum = (double)e.ActualMaximum;
}
LabelCreated
The LabelCreated event is triggered when the axis label is created. The ChartAxisLabelEventArgs contains the following information:
- Label - used to get or set the text of the axis label.
- Position - used to get the position of the label.
- LabelStyle - used to customize the appearance of axis labels.
SfCartesianChart chart = new SfCartesianChart();
NumericalAxis primaryAxis = new NumericalAxis();
primaryAxis.LabelCreated += PrimaryAxis_LabelCreated;
chart.XAxes.Add(primaryAxis);

private void PrimaryAxis_LabelCreated(object sender, ChartAxisLabelEventArgs e)
{
    string label = e.Label;
    double position = e.Position;
}