Grid Lines in .NET MAUI Cartesian Chart
10 Jul 20267 minutes to read
Major Grid Lines
By default, major gridlines are automatically added to the ChartAxis in its defined intervals. The visibility of the major gridlines can be controlled using the ShowMajorGridLines property. The default value of ShowMajorGridLines is true.
NOTE
Prerequisite: Ensure that the required NuGet package is installed, the necessary namespaces are imported, and the SfCartesianChart control is properly configured in your application. For detailed setup and configuration instructions, refer to the Getting Started guide.
<chart:SfCartesianChart>
    <chart:SfCartesianChart.XAxes>
        <chart:NumericalAxis ShowMajorGridLines="False"/>
    </chart:SfCartesianChart.XAxes>
    <chart:SfCartesianChart.YAxes>
        <chart:NumericalAxis/>
    </chart:SfCartesianChart.YAxes>
    <!-- code omitted for brevity -->
</chart:SfCartesianChart>
SfCartesianChart chart = new SfCartesianChart();
NumericalAxis primaryAxis = new NumericalAxis();
primaryAxis.ShowMajorGridLines = false;
chart.XAxes.Add(primaryAxis);
NumericalAxis secondaryAxis = new NumericalAxis();
chart.YAxes.Add(secondaryAxis);
// code omitted for brevity
this.Content = chart;
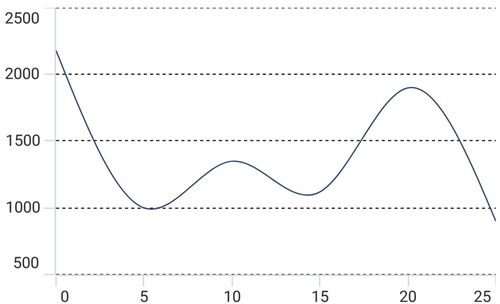
Customization
The MajorGridLineStyle property in the chart axis is used to customize the appearance of major gridlines.
<chart:SfCartesianChart>
    <chart:SfCartesianChart.Resources>
        <DoubleCollection x:Key="dashArray">
            <x:Double>3</x:Double>
            <x:Double>3</x:Double>
        </DoubleCollection>
    </chart:SfCartesianChart.Resources>

    <chart:SfCartesianChart.XAxes>
        <chart:NumericalAxis>
            <chart:NumericalAxis.MajorGridLineStyle>
                <chart:ChartLineStyle StrokeDashArray="{StaticResource dashArray}"
                                      Stroke="Black"
                                      StrokeWidth="2"/>
            </chart:NumericalAxis.MajorGridLineStyle>
        </chart:NumericalAxis>
    </chart:SfCartesianChart.XAxes>

    <chart:SfCartesianChart.YAxes>
        <chart:NumericalAxis/>
    </chart:SfCartesianChart.YAxes>
    <!-- code omitted for brevity -->
</chart:SfCartesianChart>
SfCartesianChart chart = new SfCartesianChart();
DoubleCollection doubleCollection = new DoubleCollection();
doubleCollection.Add(3);
doubleCollection.Add(3);
NumericalAxis primaryAxis = new NumericalAxis();
ChartLineStyle gridLineStyle = new ChartLineStyle()
{
Stroke = new SolidColorBrush(Colors.Black),
StrokeWidth = 2,
StrokeDashArray = doubleCollection,
};
primaryAxis.MajorGridLineStyle = gridLineStyle;
chart.XAxes.Add(primaryAxis);
NumericalAxis secondaryAxis = new NumericalAxis();
chart.YAxes.Add(secondaryAxis);
// code omitted for brevity
this.Content = chart;
Minor Grid Lines
Minor gridlines are added automatically when minor ticks are enabled by setting the MinorTicksPerInterval property of the chart axis (available on axes derived from RangeAxisBase). The visibility of the minor gridlines can be controlled using the ShowMinorGridLines property. The default value of ShowMinorGridLines is true.
<chart:SfCartesianChart>
    <chart:SfCartesianChart.XAxes>
        <chart:NumericalAxis/>
    </chart:SfCartesianChart.XAxes>

    <chart:SfCartesianChart.YAxes>
        <chart:NumericalAxis MinorTicksPerInterval="3"
                             ShowMinorGridLines="True"/>
    </chart:SfCartesianChart.YAxes>
    <!-- code omitted for brevity -->
</chart:SfCartesianChart>
SfCartesianChart chart = new SfCartesianChart();
NumericalAxis primaryAxis = new NumericalAxis();
chart.XAxes.Add(primaryAxis);
NumericalAxis secondaryAxis = new NumericalAxis()
{
MinorTicksPerInterval = 3,
ShowMinorGridLines = true,
};
chart.YAxes.Add(secondaryAxis);
// code omitted for brevity
this.Content = chart;Customization
The MinorGridLineStyle property in the chart axis is used to customize the appearance of minor gridlines.
<chart:SfCartesianChart>
    <chart:SfCartesianChart.Resources>
        <DoubleCollection x:Key="dashArray">
            <x:Double>3</x:Double>
            <x:Double>3</x:Double>
        </DoubleCollection>
    </chart:SfCartesianChart.Resources>

    <chart:SfCartesianChart.XAxes>
        <chart:NumericalAxis/>
    </chart:SfCartesianChart.XAxes>

    <chart:SfCartesianChart.YAxes>
        <chart:NumericalAxis ShowMinorGridLines="True" MinorTicksPerInterval="3">
            <chart:NumericalAxis.MinorGridLineStyle>
                <chart:ChartLineStyle StrokeDashArray="{StaticResource dashArray}"
                                      Stroke="Black"
                                      StrokeWidth="0.8"/>
            </chart:NumericalAxis.MinorGridLineStyle>
        </chart:NumericalAxis>
    </chart:SfCartesianChart.YAxes>
    <!-- code omitted for brevity -->
</chart:SfCartesianChart>
SfCartesianChart chart = new SfCartesianChart();
DoubleCollection doubleCollection = new DoubleCollection();
doubleCollection.Add(3);
doubleCollection.Add(3);
NumericalAxis primaryAxis = new NumericalAxis();
chart.XAxes.Add(primaryAxis);
NumericalAxis secondaryAxis = new NumericalAxis() { MinorTicksPerInterval = 3 };
ChartLineStyle gridLineStyle = new ChartLineStyle()
{
Stroke = new SolidColorBrush(Colors.Black),
StrokeWidth = 0.8,
StrokeDashArray = doubleCollection,
};
secondaryAxis.MinorGridLineStyle = gridLineStyle;
chart.YAxes.Add(secondaryAxis);
// code omitted for brevity
this.Content = chart;