How can I help you?
Thumb and Thumb overlay in Flutter Range Selector (SfRangeSelector)
21 May 202524 minutes to read
This section helps to learn about how to customize the thumb and thumb overlay in the range selector.
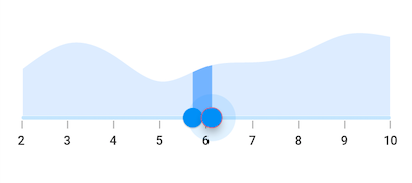
- Thumb - It is one of the elements of range selector which can be used to drag and change the selected values of the range selector.
- Thumb overlay - It is rendered around the thumb while interacting with them.
Thumb size
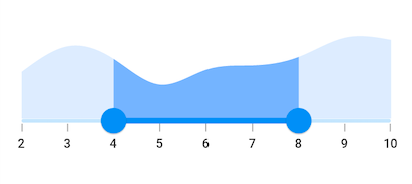
You can change the size of the thumb in the range selector using the thumbRadius property.
NOTE
You must import the
theme.dartlibrary from theCorepackage to useSfRangeSelectorTheme.
final double _min = 2.0;
final double _max = 10.0;
SfRangeValues _values = SfRangeValues(4.0, 8.0);

final List<Data> chartData = <Data>[
    Data(x:2.0, y: 2.2),
    Data(x:3.0, y: 3.4),
    Data(x:4.0, y: 2.8),
    Data(x:5.0, y: 1.6),
    Data(x:6.0, y: 2.3),
    Data(x:7.0, y: 2.5),
    Data(x:8.0, y: 2.9),
    Data(x:9.0, y: 3.8),
    Data(x:10.0, y: 3.7),
];

@override
Widget build(BuildContext context) {
  return MaterialApp(
      home: Scaffold(
          body: Center(
              child: SfRangeSelectorTheme(
                    data: SfRangeSelectorThemeData(
                        thumbRadius: 13,
                    ),
                    child:  SfRangeSelector(
                        min: _min,
                        max: _max,
                        interval: 1,
                        showTicks: true,
                        showLabels: true,
                        initialValues: _values,
                        child: Container(
                        height: 130,
                        child: SfCartesianChart(
                            margin: const EdgeInsets.all(0),
                            primaryXAxis: NumericAxis(minimum: _min,
                                maximum: _max,
                                isVisible: false),
                            primaryYAxis: NumericAxis(isVisible: false),
                            plotAreaBorderWidth: 0,
                            series: <SplineAreaSeries<Data, double>>[
                                SplineAreaSeries<Data, double>(
                                    color: Color.fromARGB(255, 126, 184, 253),
                                        dataSource: chartData,
                                            xValueMapper: (Data sales, int index) => sales.x,
                                            yValueMapper: (Data sales, int index) => sales.y)
                                ],
                            ),
                        ),
                   ),
              ),
          )
      )
  );
}

class Data {
  Data({required this.x, required this.y});
  final double x;
  final double y;
}
Thumb color
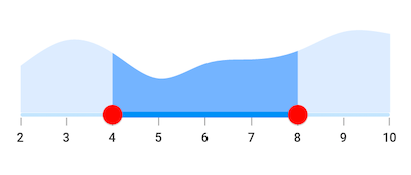
You can change the color of the thumb in the range selector using the thumbColor property.
NOTE
You must import the
theme.dartlibrary from theCorepackage to useSfRangeSelectorTheme.
final double _min = 2.0;
final double _max = 10.0;
SfRangeValues _values = SfRangeValues(4.0, 8.0);

final List<Data> chartData = <Data>[
    Data(x:2.0, y: 2.2),
    Data(x:3.0, y: 3.4),
    Data(x:4.0, y: 2.8),
    Data(x:5.0, y: 1.6),
    Data(x:6.0, y: 2.3),
    Data(x:7.0, y: 2.5),
    Data(x:8.0, y: 2.9),
    Data(x:9.0, y: 3.8),
    Data(x:10.0, y: 3.7),
];

@override
Widget build(BuildContext context) {
  return MaterialApp(
      home: Scaffold(
          body: Center(
              child: SfRangeSelectorTheme(
                    data: SfRangeSelectorThemeData(
                        thumbColor: Colors.red,
                    ),
                    child:  SfRangeSelector(
                        min: _min,
                        max: _max,
                        interval: 1,
                        showTicks: true,
                        showLabels: true,
                        initialValues: _values,
                        child: Container(
                        height: 130,
                        child: SfCartesianChart(
                            margin: const EdgeInsets.all(0),
                            primaryXAxis: NumericAxis(minimum: _min,
                                maximum: _max,
                                isVisible: false),
                            primaryYAxis: NumericAxis(isVisible: false),
                            plotAreaBorderWidth: 0,
                            series: <SplineAreaSeries<Data, double>>[
                                SplineAreaSeries<Data, double>(
                                    color: Color.fromARGB(255, 126, 184, 253),
                                        dataSource: chartData,
                                            xValueMapper: (Data sales, int index) => sales.x,
                                            yValueMapper: (Data sales, int index) => sales.y)
                                ],
                            ),
                        ),
                   ),
              ),
          )
      )
  );
}

class Data {
  Data({required this.x, required this.y});
  final double x;
  final double y;
}
Thumb stroke width and stroke color
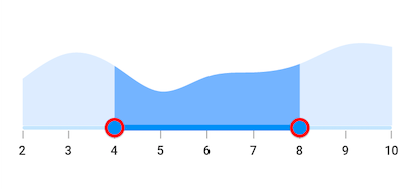
You can change the thumb stroke width using the thumbStrokeWidth property and thumb stroke color using the thumbStrokeColor property.
NOTE
You must import the
theme.dartlibrary from theCorepackage to useSfRangeSelectorTheme.
final double _min = 2.0;
final double _max = 10.0;
SfRangeValues _values = SfRangeValues(4.0, 8.0);

final List<Data> chartData = <Data>[
  Data(x:2.0, y: 2.2),
  Data(x:3.0, y: 3.4),
  Data(x:4.0, y: 2.8),
  Data(x:5.0, y: 1.6),
  Data(x:6.0, y: 2.3),
  Data(x:7.0, y: 2.5),
  Data(x:8.0, y: 2.9),
  Data(x:9.0, y: 3.8),
  Data(x:10.0, y: 3.7),
];

@override
Widget build(BuildContext context) {
  return MaterialApp(
      home: Scaffold(
        body: Center(
            child: SfRangeSelectorTheme(
              data: SfRangeSelectorThemeData(
                thumbStrokeWidth: 3,
                thumbStrokeColor: Colors.red,
              ),
              child: SfRangeSelector(
                min: _min,
                max: _max,
                interval: 1,
                showTicks: true,
                showLabels: true,
                initialValues: _values,
                child: Container(
                  height: 130,
                  child: SfCartesianChart(
                    margin: const EdgeInsets.all(0),
                    primaryXAxis: NumericAxis(minimum: _min,
                        maximum: _max,
                        isVisible: false),
                    primaryYAxis: NumericAxis(isVisible: false),
                    plotAreaBorderWidth: 0,
                    series: <SplineAreaSeries<Data, double>>[
                      SplineAreaSeries<Data, double>(
                          color: Color.fromARGB(255, 126, 184, 253),
                          dataSource: chartData,
                          xValueMapper: (Data sales, int index) => sales.x,
                          yValueMapper: (Data sales, int index) => sales.y)
                    ],
                  ),
                ),
              ),
            ),
          )
      )
  );
}

class Data {
  Data({required this.x, required this.y});
  final double x;
  final double y;
}
Thumb icon
You can show the custom widgets like icon or text inside the thumbs using the startThumbIcon and the endThumbIcon properties.
final double _min = 2.0;
final double _max = 10.0;
SfRangeValues _values = SfRangeValues(4.0, 8.0);

final List<Data> chartData = <Data>[
  Data(x:2.0, y: 2.2),
  Data(x:3.0, y: 3.4),
  Data(x:4.0, y: 2.8),
  Data(x:5.0, y: 1.6),
  Data(x:6.0, y: 2.3),
  Data(x:7.0, y: 2.5),
  Data(x:8.0, y: 2.9),
  Data(x:9.0, y: 3.8),
  Data(x:10.0, y: 3.7),
];

@override
Widget build(BuildContext context) {
  return MaterialApp(
      home: Scaffold(
          body: Center(
            child: SfRangeSelectorTheme(
              data: SfRangeSelectorThemeData(
                  thumbColor: Colors.white,
                  thumbRadius: 15,
                  thumbStrokeWidth: 2,
                  thumbStrokeColor: Colors.blue
              ),
              child: SfRangeSelector(
                min: _min,
                max: _max,
                interval: 1,
                showTicks: true,
                showLabels: true,
                initialValues: _values,
                startThumbIcon: Icon(
                    Icons.arrow_back_ios,
                    color: Colors.blue,
                    size: 20.0),
                endThumbIcon: Icon(
                    Icons.arrow_forward_ios,
                    color: Colors.blue,
                    size: 20.0),
                child: Container(
                  height: 130,
                  child: SfCartesianChart(
                    margin: const EdgeInsets.all(0),
                    primaryXAxis: NumericAxis(minimum: _min,
                        maximum: _max,
                        isVisible: false),
                    primaryYAxis: NumericAxis(isVisible: false),
                    plotAreaBorderWidth: 0,
                    series: <SplineAreaSeries<Data, double>>[
                      SplineAreaSeries<Data, double>(
                          color: Color.fromARGB(255, 126, 184, 253),
                          dataSource: chartData,
                          xValueMapper: (Data sales, int index) => sales.x,
                          yValueMapper: (Data sales, int index) => sales.y)
                    ],
                  ),
                ),
              ),
            ),
          )
      )
  );
}

class Data {
  Data({required this.x, required this.y});
  final double x;
  final double y;
}![]()
Thumb overlay size
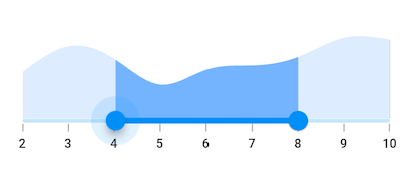
You can change the size of the thumb overlay in the range selector using the overlayRadius property.
NOTE
You must import the
theme.dartlibrary from theCorepackage to useSfRangeSelectorTheme.
final double _min = 2.0;
final double _max = 10.0;
SfRangeValues _values = SfRangeValues(4.0, 8.0);

final List<Data> chartData = <Data>[
    Data(x:2.0, y: 2.2),
    Data(x:3.0, y: 3.4),
    Data(x:4.0, y: 2.8),
    Data(x:5.0, y: 1.6),
    Data(x:6.0, y: 2.3),
    Data(x:7.0, y: 2.5),
    Data(x:8.0, y: 2.9),
    Data(x:9.0, y: 3.8),
    Data(x:10.0, y: 3.7),
];

@override
Widget build(BuildContext context) {
  return MaterialApp(
      home: Scaffold(
          body: Center(
              child: SfRangeSelectorTheme(
                    data: SfRangeSelectorThemeData(
                        overlayRadius: 25,
                    ),
                    child:  SfRangeSelector(
                        min: _min,
                        max: _max,
                        interval: 1,
                        showTicks: true,
                        showLabels: true,
                        initialValues: _values,
                        child: Container(
                        height: 130,
                        child: SfCartesianChart(
                            margin: const EdgeInsets.all(0),
                            primaryXAxis: NumericAxis(minimum: _min,
                                maximum: _max,
                                isVisible: false),
                            primaryYAxis: NumericAxis(isVisible: false),
                            plotAreaBorderWidth: 0,
                            series: <SplineAreaSeries<Data, double>>[
                                SplineAreaSeries<Data, double>(
                                    color: Color.fromARGB(255, 126, 184, 253),
                                        dataSource: chartData,
                                            xValueMapper: (Data sales, int index) => sales.x,
                                            yValueMapper: (Data sales, int index) => sales.y)
                                ],
                            ),
                        ),
                   ),
              ),
          )
      )
  );
}

class Data {
  Data({required this.x, required this.y});
  final double x;
  final double y;
}
Thumb overlay color
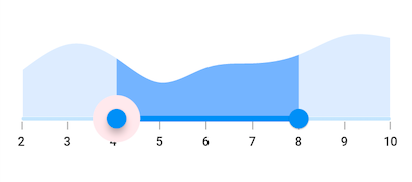
You can change the color of the thumb overlay in the range selector using the overlayColor property.
NOTE
You must import the
theme.dartlibrary from theCorepackage to useSfRangeSelectorTheme.
final double _min = 2.0;
final double _max = 10.0;
SfRangeValues _values = SfRangeValues(4.0, 8.0);

final List<Data> chartData = <Data>[
    Data(x:2.0, y: 2.2),
    Data(x:3.0, y: 3.4),
    Data(x:4.0, y: 2.8),
    Data(x:5.0, y: 1.6),
    Data(x:6.0, y: 2.3),
    Data(x:7.0, y: 2.5),
    Data(x:8.0, y: 2.9),
    Data(x:9.0, y: 3.8),
    Data(x:10.0, y: 3.7),
];

@override
Widget build(BuildContext context) {
  return MaterialApp(
      home: Scaffold(
          body: Center(
              child: SfRangeSelectorTheme(
                    data: SfRangeSelectorThemeData(
                        overlayColor: Colors.red[50],
                    ),
                    child:  SfRangeSelector(
                        min: _min,
                        max: _max,
                        interval: 1,
                        showTicks: true,
                        showLabels: true,
                        initialValues: _values,
                        child: Container(
                        height: 130,
                        child: SfCartesianChart(
                            margin: const EdgeInsets.all(0),
                            primaryXAxis: NumericAxis(minimum: _min,
                                maximum: _max,
                                isVisible: false),
                            primaryYAxis: NumericAxis(isVisible: false),
                            plotAreaBorderWidth: 0,
                            series: <SplineAreaSeries<Data, double>>[
                                SplineAreaSeries<Data, double>(
                                    color: Color.fromARGB(255, 126, 184, 253),
                                        dataSource: chartData,
                                            xValueMapper: (Data sales, int index) => sales.x,
                                            yValueMapper: (Data sales, int index) => sales.y)
                                ],
                            ),
                        ),
                   ),
              ),
          )
      )
  );
}

class Data {
  Data({required this.x, required this.y});
  final double x;
  final double y;
}
Thumb overlap stroke color
You can change the overlap stroke color of the thumb in the range selector using the overlappingThumbStrokeColor property.
NOTE
You must import the
theme.dartlibrary from theCorepackage to useSfRangeSelectorTheme.
final double _min = 2.0;
final double _max = 10.0;
SfRangeValues _values = SfRangeValues(4.0, 8.0);

final List<Data> chartData = <Data>[
    Data(x:2.0, y: 2.2),
    Data(x:3.0, y: 3.4),
    Data(x:4.0, y: 2.8),
    Data(x:5.0, y: 1.6),
    Data(x:6.0, y: 2.3),
    Data(x:7.0, y: 2.5),
    Data(x:8.0, y: 2.9),
    Data(x:9.0, y: 3.8),
    Data(x:10.0, y: 3.7),
];

@override
Widget build(BuildContext context) {
  return MaterialApp(
      home: Scaffold(
          body: Center(
              child: SfRangeSelectorTheme(
                    data: SfRangeSelectorThemeData(
                        overlappingThumbStrokeColor: Colors.red,
                    ),
                    child:  SfRangeSelector(
                        min: _min,
                        max: _max,
                        interval: 1,
                        showTicks: true,
                        showLabels: true,
                        initialValues: _values,
                        child: Container(
                        height: 130,
                        child: SfCartesianChart(
                            margin: const EdgeInsets.all(0),
                            primaryXAxis: NumericAxis(minimum: _min,
                                maximum: _max,
                                isVisible: false),
                            primaryYAxis: NumericAxis(isVisible: false),
                            plotAreaBorderWidth: 0,
                            series: <SplineAreaSeries<Data, double>>[
                                SplineAreaSeries<Data, double>(
                                    color: Color.fromARGB(255, 126, 184, 253),
                                        dataSource: chartData,
                                            xValueMapper: (Data sales, int index) => sales.x,
                                            yValueMapper: (Data sales, int index) => sales.y)
                                ],
                            ),
                        ),
                   ),
              ),
          )
      )
  );
}

class Data {
  Data({required this.x, required this.y});
  final double x;
  final double y;
}