Controller in Flutter Range Selector (SfRangeSelector)
27 Jul 202524 minutes to read
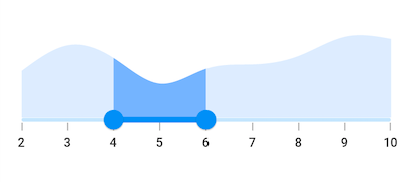
You can use RangeController for setting and getting current selected values of range selector.
The start represents the currently selected start value of the range selector. The left thumb of the range selector was drawn corresponding to this value.
The end represents the currently selected end value of the range selector. The right thumb of the range selector was drawn corresponding to this value.
You can get previous values using previousStart and previousEnd properties.
The start, end, previousStart, previousEnd properties can be either double or DateTime based on whether it is date type SfRangeSelector or numeric SfRangeSelector.
IMPORTANT
You need not to set the
initialValuesproperty when usingcontrollerproperty in the range selector.
NOTE
You must import the
Coreto use the range controller in the range selector.
final double _min = 2.0;
final double _max = 10.0;
SfRangeValues _values = SfRangeValues(4.0, 6.0);
RangeController _rangeController;

@override
void initState() {
   super.initState();
     _rangeController = RangeController(
     start: _values.start,
     end: _values.end);
}

@override
void dispose() {
   _rangeController.dispose();
   super.dispose();
}

final List<Data> chartData = <Data>[
    Data(x:2.0, y: 2.2),
    Data(x:3.0, y: 3.4),
    Data(x:4.0, y: 2.8),
    Data(x:5.0, y: 1.6),
    Data(x:6.0, y: 2.3),
    Data(x:7.0, y: 2.5),
    Data(x:8.0, y: 2.9),
    Data(x:9.0, y: 3.8),
    Data(x:10.0, y: 3.7),
];

@override
Widget build(BuildContext context) {
  return MaterialApp(
      home: Scaffold(
          body: Center(
              child: SfRangeSelector(
                    min: _min,
                    max: _max,
                    interval: 1,
                    showTicks: true,
                    showLabels: true,
                    controller: _rangeController,
                    child: Container(
                    height: 130,
                    child: SfCartesianChart(
                        margin: const EdgeInsets.all(0),
                        primaryXAxis: NumericAxis(minimum: _min,
                            maximum: _max,
                            isVisible: false),
                        primaryYAxis: NumericAxis(isVisible: false),
                        plotAreaBorderWidth: 0,
                        series: <SplineAreaSeries<Data, double>>[
                            SplineAreaSeries<Data, double>(
                                color: Color.fromARGB(255, 126, 184, 253),
                                dataSource: chartData,
                                    xValueMapper: (Data sales, int index) => sales.x,
                                    yValueMapper: (Data sales, int index) => sales.y)
                            ],
                        ),
                   ),
              ),
          )
      )
  );
}

class Data {
  Data({required this.x, required this.y});
  final double x;
  final double y;
}
Selection with SfChart
We have provided built-in support for selecting the chart segments based on the selected range in range selector. To achieve this segment selection, you must set the SelectionSettings.selectionController property in the SfCartesianChart.series property.
SfRangeValues _values = SfRangeValues(DateTime(2010, 03, 01), DateTime(2010, 06, 01));
RangeController _rangeController;

@override
void initState() {
  super.initState();
    _rangeController = RangeController(
       start: _values.start,
       end: _values.end);
}

@override
void dispose() {
   _rangeController.dispose();
   super.dispose();
}

final List<Data> chartData = <Data>[
    Data(x: DateTime(2010, 01, 01), y: 2.2),
    Data(x: DateTime(2010, 02, 01), y: 3.4),
    Data(x: DateTime(2010, 03, 01), y: 2.8),
    Data(x: DateTime(2010, 04, 01), y: 1.6),
    Data(x: DateTime(2010, 05, 01), y: 2.3),
    Data(x: DateTime(2010, 06, 01), y: 2.5),
    Data(x: DateTime(2010, 07, 01), y: 2.9),
    Data(x: DateTime(2010, 08, 01), y: 3.8),
    Data(x: DateTime(2010, 09, 01), y: 3.7),
];

@override
Widget build(BuildContext context) {
  return Scaffold(
    body: Center(
      child: SfRangeSelector(
        min: DateTime(2010, 01, 01),
        max: DateTime(2010, 09, 01),
        interval: 2,
        dateIntervalType: DateIntervalType.months,
        dateFormat: DateFormat.yM(),
        showTicks: true,
        showLabels: true,
        controller: _rangeController,
        onChanged: (SfRangeValues values) {
          setState(() {});
        },
        child: SizedBox(
          height: 130,
          child: SfCartesianChart(
            margin: EdgeInsets.zero,
            primaryXAxis: DateTimeAxis(
              minimum: DateTime(2010, 01, 01),
              maximum: DateTime(2010, 09, 01),
              isVisible: false,
            ),
            primaryYAxis: const NumericAxis(isVisible: false),
            plotAreaBorderWidth: 0,
            plotAreaBackgroundColor: Colors.transparent,
            series: <ColumnSeries<Data, DateTime>>[
              ColumnSeries<Data, DateTime>(
                dataSource: chartData,
                selectionBehavior: SelectionBehavior(
                  selectionController: _rangeController,
                ),
                xValueMapper: (Data sales, int index) => sales.x,
                yValueMapper: (Data sales, int index) => sales.y,
                pointColorMapper: (Data sales, int index) {
                  if (sales.x.isAfter(_rangeController.start) &&
                      sales.x.isBefore(_rangeController.end)) {
                    return const Color.fromRGBO(0, 178, 206, 1);
                  }
                  return Colors.transparent;
                },
                color: const Color.fromRGBO(255, 255, 255, 0),
                dashArray: const <double>[5, 4],
                borderColor: const Color.fromRGBO(194, 194, 194, 1),
                animationDuration: 0,
                borderWidth: 1,
              ),
            ],
          ),
        ),
      ),
    ),
  );
}class Data {
Data({this.x, this.y});
final DateTime x;
final double y;
}
Zooming with SfChart
We have provided built-in support for updating the visible range of the chart based on the selected range in range selector. To update the visible range, you must set the primaryYAxis.rangeController property in the SfCartesianChart.
final double _min = 2.0;
final double _max = 19.0;
SfRangeValues _values = SfRangeValues(8.0, 16.0);
RangeController _rangeController;
SfCartesianChart splineChart;

@override
void initState() {
    super.initState();
    _rangeController = RangeController(start: _values.start, end: _values.end);
}

@override
void dispose() {
    _rangeController.dispose();
    super.dispose();
}

final List<Data> chartData = <Data>[
    Data(x: 2.0, y: 2.2),
    Data(x: 3.0, y: 3.4),
    Data(x: 4.0, y: 2.8),
    Data(x: 5.0, y: 1.6),
    Data(x: 6.0, y: 2.3),
    Data(x: 7.0, y: 2.5),
    Data(x: 8.0, y: 2.9),
    Data(x: 9.0, y: 3.8),
    Data(x: 10.0, y: 3.7),
    Data(x: 11.0, y: 2.2),
    Data(x: 12.0, y: 3.4),
    Data(x: 13.0, y: 2.8),
    Data(x: 14.0, y: 1.6),
    Data(x: 15.0, y: 2.3),
    Data(x: 16.0, y: 2.5),
    Data(x: 17.0, y: 2.9),
    Data(x: 18.0, y: 3.8),
    Data(x: 19.0, y: 3.7),
];

@override
Widget build(BuildContext context) {
    splineChart = SfCartesianChart(
      margin: const EdgeInsets.only(left: 10, right: 10, bottom: 20),
      primaryXAxis: NumericAxis(
          minimum: _min,
          maximum: _max,
          isVisible: true,
          rangeController: _rangeController),
      primaryYAxis: NumericAxis(isVisible: true),
      plotAreaBorderWidth: 0,
      series: <SplineSeries<Data, double>>[
        SplineSeries<Data, double>(
            color: Color.fromARGB(255, 126, 184, 253),
            dataSource: chartData,
            animationDuration: 0,
            xValueMapper: (Data sales, int index) => sales.x,
            yValueMapper: (Data sales, int index) => sales.y)
      ],
    );

    return Scaffold(
        body: Center(
          child: Padding(
            padding: EdgeInsets.only(left: 10, right: 10, top: 80),
            child: Column(
              children: <Widget>[
                Container(
                  child: splineChart,
                ),
                SfRangeSelector(
                  min: _min,
                  max: _max,
                  interval: 2,
                  showTicks: true,
                  showLabels: true,
                  controller: _rangeController,
                  child: Container(
                    height: 130,
                    child: SfCartesianChart(
                      margin: const EdgeInsets.all(0),
                      primaryXAxis: NumericAxis(
                          minimum: _min,
                          maximum: _max,
                          isVisible: false),
                      primaryYAxis: NumericAxis(isVisible: false),
                      plotAreaBorderWidth: 0,
                      series: <SplineSeries<Data, double>>[
                        SplineSeries<Data, double>(
                            color: Color.fromARGB(255, 126, 184, 253),
                            dataSource: chartData,
                            xValueMapper: (Data sales, int index) => sales.x,
                            yValueMapper: (Data sales, int index) => sales.y)
                      ],
                    ),
                  ),
                ),
              ],
            ),
          ),
       )
    );
}

class Data {
  Data({required this.x, required this.y});
  final double x;
  final double y;
}
Deferred update
You can control when the dependent components are updated while thumbs are being dragged continuously. It can be achieved by setting the SfRangeSelector.enableDeferredUpdate property and the delay in the update can be achieved by setting the SfRangeSelector.deferredUpdateDelay property. The default value of the deferredUpdateDelay property is 500 milliseconds.
It updates the controller start and end values and invoke the onChanged callback when the thumb is dragged and held for the duration specified in the deferredUpdateDelay. However, range values are immediately updated in touch up action.
final DateTime min = DateTime(2000, 01, 01, 0), max = DateTime(2000, 12, 15);
RangeController rangeController;
SfCartesianChart splineAreaChart, splineChart;
List<Data> data;

@override
void initState() {
    super.initState();
    rangeController = RangeController(
      start: DateTime(2000, 04, 15),
      end: DateTime(2000, 07, 15),
    );

    data = <Data>[
      Data(x: DateTime(2000, 01, 01, 0), y: 100),
      Data(x: DateTime(2000, 01, 15), y: 10),
      Data(x: DateTime(2000, 02, 01), y: 40),
      Data(x: DateTime(2000, 02, 15), y: 34),
      Data(x: DateTime(2000, 03, 01), y: 80),
      Data(x: DateTime(2000, 03, 15), y: 49),
      Data(x: DateTime(2000, 04, 01), y: 56),
      Data(x: DateTime(2000, 04, 15), y: 26),
      Data(x: DateTime(2000, 05, 01), y: 8),
      Data(x: DateTime(2000, 05, 15), y: 80),
      Data(x: DateTime(2000, 06, 01), y: 42),
      Data(x: DateTime(2000, 06, 15), y: 12),
      Data(x: DateTime(2000, 07, 01), y: 28),
      Data(x: DateTime(2000, 07, 15), y: 68),
      Data(x: DateTime(2000, 08, 01), y: 94),
      Data(x: DateTime(2000, 08, 15), y: 24),
      Data(x: DateTime(2000, 09, 01), y: 72),
      Data(x: DateTime(2000, 09, 15), y: 32),
      Data(x: DateTime(2000, 10, 01), y: 48),
      Data(x: DateTime(2000, 10, 15), y: 4),
      Data(x: DateTime(2000, 11, 01), y: 64),
      Data(x: DateTime(2000, 11, 15), y: 10),
      Data(x: DateTime(2000, 12, 01), y: 85),
      Data(x: DateTime(2000, 12, 15), y: 96),
    ];

    splineAreaChart = SfCartesianChart(
      margin: const EdgeInsets.all(0),
      primaryXAxis: DateTimeAxis(isVisible: false, maximum: max),
      primaryYAxis: NumericAxis(isVisible: false),
      plotAreaBorderWidth: 0,
      series: <SplineAreaSeries<Data, DateTime>>[
        SplineAreaSeries<Data, DateTime>(
          dataSource: data,
          xValueMapper: (Data sales, int index) => sales.x,
          yValueMapper: (Data sales, int index) => sales.y,
        )
      ],
   );
}

@override
Widget build(BuildContext context) {
    splineChart = SfCartesianChart(
      plotAreaBorderWidth: 0,
      primaryXAxis: DateTimeAxis(
          isVisible: false,
          minimum: min,
          maximum: max,
          rangeController: rangeController),
      primaryYAxis: NumericAxis(
        labelPosition: ChartDataLabelPosition.inside,
        labelAlignment: LabelAlignment.end,
        majorTickLines: MajorTickLines(size: 0),
        axisLine: AxisLine(color: Colors.transparent),
      ),
      series: <SplineSeries<Data, DateTime>>[
        SplineSeries<Data, DateTime>(
          dataSource: data,
          animationDuration: 0,
          xValueMapper: (Data sales, int index) => sales.x,
          yValueMapper: (Data sales, int index) => sales.y,
        )
      ],
    );
    final Widget page = Container(
        margin: const EdgeInsets.all(0),
        padding: const EdgeInsets.all(0),
        child: Center(
          child: Column(
            children: <Widget>[
              Expanded(
                child: Container(
                    padding: const EdgeInsets.fromLTRB(5, 20, 15, 25),
                    child: splineChart),
              ),
              Container(
                margin: const EdgeInsets.all(0),
                padding: const EdgeInsets.all(0),
                child: Center(
                  child: Padding(
                    padding: const EdgeInsets.fromLTRB(14, 0, 15, 15),
                    child: SfRangeSelector(
                      min: min,
                      max: max,
                      interval: 1,
                      enableDeferredUpdate: true,
                      deferredUpdateDelay: 500,
                      labelPlacement: LabelPlacement.betweenTicks,
                      dateIntervalType: DateIntervalType.months,
                      controller: rangeController,
                      showTicks: true,
                      showLabels: true,
                      dragMode: SliderDragMode.both,
                      labelFormatterCallback:
                          (dynamic actualLabel, String formattedText) {
                        String label = DateFormat.MMM().format(actualLabel);
                        label = label;
                        return label;
                      },
                      onChanged: (SfRangeValues values) {},
                      child: Container(
                        child: splineAreaChart,
                        height: 75,
                        padding: const EdgeInsets.all(0),
                        margin: const EdgeInsets.all(0),
                      ),
                    ),
                  ),
                ),
              ),
            ],
          ),
        )
     );
    return Scaffold(
      body: Center(
        child: Container(height: 400, child: page),
      )
   );
}