Getting started with Flutter Range Selector (SfRangeSelector)
21 May 202524 minutes to read
This section explains the steps required to add the range selector widget and its elements such as numeric and date values, ticks, labels and tooltips. This section covers only basic features needed to know to get started with Syncfusion® range selector.
To get start quickly with our Flutter Range Selector widget, you can check out this video.
Add Flutter range selector to an application
Create a simple project using the instructions given in the Getting Started with your first Flutter app documentation.
Add dependency
Add the Syncfusion® Flutter range selector dependency to your pubspec.yaml file.
dependencies:

syncfusion_flutter_sliders: ^xx.x.xx
NOTE
Here xx.x.xx denotes the current version of
Syncfusion Flutter Sliderspackage.
Get packages
Run the following command to get the required packages.
$ flutter pub getImport package
Import the following package in your Dart code.
import 'package:syncfusion_flutter_sliders/sliders.dart';Initialize range selector
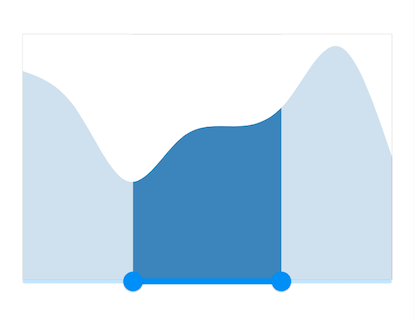
After importing the package, initialize the range selector widget as a child of any widget. Here, the range selector widget is added as a child of the Container widget. The default value of the min and max properties of the SfRangeSelector is 0.0 and 1.0 respectively. So, the initialValues property must be given within the range. You can add any kind of widget as a child of range selector. Here, Chart widget is added as a child.
IMPORTANT
You need to set the
controllerproperty to update range selector thumb values dynamically. Refer thislinkfor setting controller property. The initialValues property can be used to set values at load time.
final SfRangeValues _initialValues = SfRangeValues(0.3, 0.7);

final List<Data> _chartData = <Data>[
  Data(x: DateTime(2003, 01, 01), y: 3.4),
  Data(x: DateTime(2004, 01, 01), y: 2.8),
  Data(x: DateTime(2005, 01, 01), y: 1.6),
  Data(x: DateTime(2006, 01, 01), y: 2.3),
  Data(x: DateTime(2007, 01, 01), y: 2.5),
  Data(x: DateTime(2008, 01, 01), y: 2.9),
  Data(x: DateTime(2009, 01, 01), y: 3.8),
  Data(x: DateTime(2010, 01, 01), y: 2.0),
];

@override
Widget build(BuildContext context) {
  return Container(
      child: Center(
        child: SfRangeSelector(
          initialValues: _initialValues,
          child: Container(
            child: SfCartesianChart(
              margin: const EdgeInsets.all(0),
              primaryXAxis: DateTimeAxis(
                isVisible: false,),
              primaryYAxis: NumericAxis(isVisible: false, maximum: 4),
              series: <SplineAreaSeries<Data, DateTime>>[
                SplineAreaSeries<Data, DateTime>(
                    dataSource: _chartData,
                    xValueMapper: (Data sales, int index) => sales.x,
                    yValueMapper: (Data sales, int index) => sales.y)
              ],
            ),
            height: 250,
          ),
        ),
      ),
  );
}

class Data {
  Data({required this.x, required this.y});
  final DateTime x;
  final double y;
}
Handle range change
The onChanged callback is called when the user is selecting the new values.
IMPORTANT
You need to set the
controllerproperty to update range selector thumb values dynamically. Refer thislinkfor setting controller property. The initialValues property can be used to set values at load time.
final SfRangeValues _initialValues = SfRangeValues(0.3, 0.7);
final List<Data> _chartData = <Data>[
Data(x: DateTime(2003, 01, 01), y: 3.4),
Data(x: DateTime(2004, 01, 01), y: 2.8),
Data(x: DateTime(2005, 01, 01), y: 1.6),
Data(x: DateTime(2006, 01, 01), y: 2.3),
Data(x: DateTime(2007, 01, 01), y: 2.5),
Data(x: DateTime(2008, 01, 01), y: 2.9),
Data(x: DateTime(2009, 01, 01), y: 3.8),
Data(x: DateTime(2010, 01, 01), y: 2.0),
];
@override
Widget build(BuildContext context) {
return Container(
child: Center(
child: SfRangeSelector(
initialValues: _initialValues,
onChanged: (SfRangeValues values) {
},
child: Container(
child: SfCartesianChart(
margin: const EdgeInsets.all(0),
primaryXAxis: DateTimeAxis(
isVisible: false,),
primaryYAxis: NumericAxis(isVisible: false, maximum: 4),
series: <SplineAreaSeries<Data, DateTime>>[
SplineAreaSeries<Data, DateTime>(
dataSource: _chartData,
xValueMapper: (Data sales, int index) => sales.x,
yValueMapper: (Data sales, int index) => sales.y)
],
),
height: 250,
),
),
),
);
}
class Data {
Data({required this.x, required this.y});
final DateTime x;
final double y;
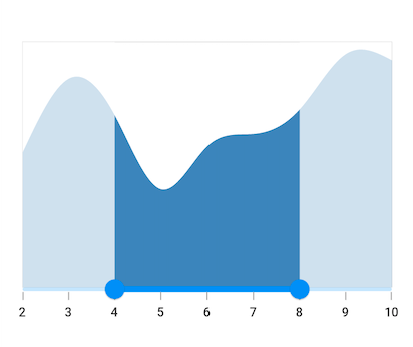
}Set numeric range
You can show numeric values in the range selector by setting double values to the min, max and initialValues properties.
IMPORTANT
You need to set the
controllerproperty to update range selector thumb values dynamically. Refer thislinkfor setting controller property. The initialValues property can be used to set values at load time.
final double _min = 2.0;
final double _max = 10.0;
SfRangeValues _initialValues = SfRangeValues(4.0, 8.0);

final List<Data> _chartData = <Data>[
    Data(x:2.0, y: 2.2),
    Data(x:3.0, y: 3.4),
    Data(x:4.0, y: 2.8),
    Data(x:5.0, y: 1.6),
    Data(x:6.0, y: 2.3),
    Data(x:7.0, y: 2.5),
    Data(x:8.0, y: 2.9),
    Data(x:9.0, y: 3.8),
    Data(x:10.0, y: 3.7),
];

@override
Widget build(BuildContext context) {
  return Container(
      child: Center(
        child: SfRangeSelector(
          min: _min,
          max: _max,
          initialValues: _initialValues,
          interval: 2,
          showLabels: true,
          child: Container(
             child: SfCartesianChart(
                  margin: const EdgeInsets.all(0),
                  primaryXAxis: NumericAxis(
                       isVisible: false,),
                  primaryYAxis: NumericAxis(isVisible: false, maximum: 4),
                  series: <SplineAreaSeries<Data, double>>[
                        SplineAreaSeries<Data, double>(
                             dataSource: _chartData,
                             xValueMapper: (Data sales, int index) => sales.x,
                             yValueMapper: (Data sales, int index) => sales.y)
                        ],
                  ),
             height: 250,
          ),
        ),
      ),
  );
}

class Data {
  Data({required this.x, required this.y});
  final double x;
  final double y;
}
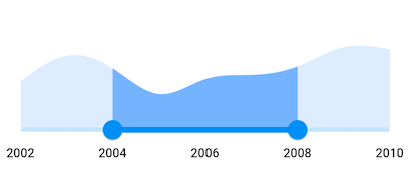
Set date range
You can show date values in the range selector by setting DateTime values to the min, max and initialValues properties.
NOTE
You must import
intlpackage for formatting date range selector using theDateFormatclass.
IMPORTANT
You need to set the
controllerproperty to update range selector thumb values dynamically. Refer thislinkfor setting controller property. The initialValues property can be used to set values at load time.
final DateTime _min = DateTime(2002, 01, 01);
final DateTime _max = DateTime(2010, 01, 01);
SfRangeValues _values = SfRangeValues(DateTime(2004, 01, 01), DateTime(2008, 01, 01));

final List<Data> _chartData = <Data>[
    Data(x: DateTime(2002, 01, 01), y: 2.2),
    Data(x: DateTime(2003, 01, 01), y: 3.4),
    Data(x: DateTime(2004, 01, 01), y: 2.8),
    Data(x: DateTime(2005, 01, 01), y: 1.6),
    Data(x: DateTime(2006, 01, 01), y: 2.3),
    Data(x: DateTime(2007, 01, 01), y: 2.5),
    Data(x: DateTime(2008, 01, 01), y: 2.9),
    Data(x: DateTime(2009, 01, 01), y: 3.8),
    Data(x: DateTime(2010, 01, 01), y: 3.7),
];

@override
Widget build(BuildContext context) {
  return Container(
      child: Center(
        child: SfRangeSelector(
         min: _min,
         max: _max,
         showLabels: true,
         interval: 2,
         dateFormat: DateFormat.y(),
         dateIntervalType: DateIntervalType.years,
         initialValues: _values,
         child: Container(
             height: 130,
             child: SfCartesianChart(
                  margin: const EdgeInsets.all(0),
                  primaryXAxis: DateTimeAxis(
                      minimum: _min,
                      maximum: _max,
                      isVisible: false),
                  primaryYAxis: NumericAxis(isVisible: false),
                  plotAreaBorderWidth: 0,
                  series: <SplineAreaSeries<Data, DateTime>>[
                        SplineAreaSeries<Data, DateTime>(
                             color: Color.fromARGB(255, 126, 184, 253),
                             dataSource: _chartData,
                                   xValueMapper: (Data sales, int index) => sales.x,
                                   yValueMapper: (Data sales, int index) => sales.y)
                             ],
                        ),
                  ),
             ),
         ),
    );
}

class Data {
  Data({required this.x, required this.y});
  final DateTime x;
  final double y;
}
Enable ticks
You can enable ticks in the range selector using the showTicks property.
IMPORTANT
You need to set the
controllerproperty to update range selector thumb values dynamically. Refer thislinkfor setting controller property. The initialValues property can be used to set values at load time.
final double _min = 2.0;
final double _max = 10.0;
SfRangeValues _initialValues = SfRangeValues(4.0, 8.0);

final List<Data> _chartData = <Data>[
    Data(x:2.0, y: 2.2),
    Data(x:3.0, y: 3.4),
    Data(x:4.0, y: 2.8),
    Data(x:5.0, y: 1.6),
    Data(x:6.0, y: 2.3),
    Data(x:7.0, y: 2.5),
    Data(x:8.0, y: 2.9),
    Data(x:9.0, y: 3.8),
    Data(x:10.0, y: 3.7),
];

@override
Widget build(BuildContext context) {
  return Container(
      child: Center(
        child: SfRangeSelector(
          min: _min,
          max: _max,
          initialValues: _initialValues,
          interval: 1,
          showLabels: true,
          showTicks: true,
          child: Container(
             child: SfCartesianChart(
                  margin: const EdgeInsets.all(0),
                  primaryXAxis: NumericAxis(
                       isVisible: false,),
                  primaryYAxis: NumericAxis(isVisible: false, maximum: 4),
                  series: <SplineAreaSeries<Data, double>>[
                        SplineAreaSeries<Data, double>(
                             dataSource: _chartData,
                             xValueMapper: (Data sales, int index) => sales.x,
                             yValueMapper: (Data sales, int index) => sales.y)
                        ],
                  ),
             height: 250,
          ),
        ),
      ),
  );
}

class Data {
  Data({required this.x, required this.y});
  final double x;
  final double y;
}
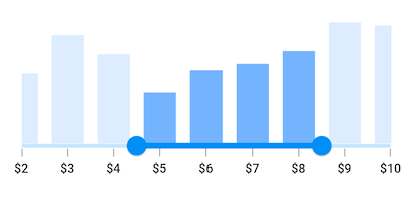
Add prefix/suffix to labels
You can add prefix or suffix to the labels using the numberFormat or dateFormat properties.
NOTE
The format type (numeric or date) of the range selector is determined based on the values specified in
min,maxandinitialValuesproperties.
IMPORTANT
You must import
intlpackage for formatting date range selector using theDateFormatclass and for formatting numeric range selector using theNumberFormatclass.
final double _min = 2.0;
final double _max = 10.0;
SfRangeValues _initialValues = SfRangeValues(4.5, 8.5);

final List<Data> _chartData = <Data>[
    Data(x:2.0, y: 2.2),
    Data(x:3.0, y: 3.4),
    Data(x:4.0, y: 2.8),
    Data(x:5.0, y: 1.6),
    Data(x:6.0, y: 2.3),
    Data(x:7.0, y: 2.5),
    Data(x:8.0, y: 2.9),
    Data(x:9.0, y: 3.8),
    Data(x:10.0, y: 3.7),
];

@override
Widget build(BuildContext context) {
  return Container(
      child: Center(
        child: SfRangeSelector(
          min: _min,
          max: _max,
          initialValues: _initialValues,
          interval: 1,
          showLabels: true,
          showTicks: true,
          numberFormat: NumberFormat("\$"),
          child: Container(
             height: 130,
             child: SfCartesianChart(
                  margin: const EdgeInsets.all(0),
                  primaryXAxis: NumericAxis(
                    isVisible: false,
                    minimum: _min,
                    maximum: _max,
                  ),
                  primaryYAxis: NumericAxis(isVisible: false, maximum: 4),
                  plotAreaBorderWidth: 0,
                  plotAreaBackgroundColor: Colors.transparent,
                  series: <ColumnSeries<Data, double>>[
                        ColumnSeries<Data, double>(
                             dataSource: _chartData,
                             color: Color.fromARGB(255, 126, 184, 253),
                             xValueMapper: (Data sales, int index) => sales.x,
                             yValueMapper: (Data sales, int index) => sales.y)
                        ],
                  ),
            ),
        ),
      ),
  );
}

class Data {
  Data({required this.x, required this.y});
  final double x;
  final double y;
}