How can I help you?
Tooltip in Xamarin Charts (SfChart)
6 Jan 20259 minutes to read
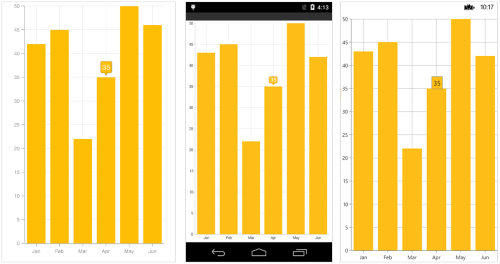
SfChart provides tooltip support for all series. It is used to show information about the segment, when you tap on the segment. To enable the tooltip, you need to set EnableTooltip property as true.
<chart:SfChart.Series>

	<chart:ColumnSeries ItemsSource="{Binding Data}" XBindingPath="Month" YBindingPath="Value" EnableTooltip="True"/>

</chart:SfChart.Series>
ColumnSeries column = new ColumnSeries ();
column.XBindingPath = "Month";
column.YBindingPath = "Value";
column.ItemsSource = Data;
column.EnableTooltip = true;
chart.Series.Add(column);
Customizing appearance
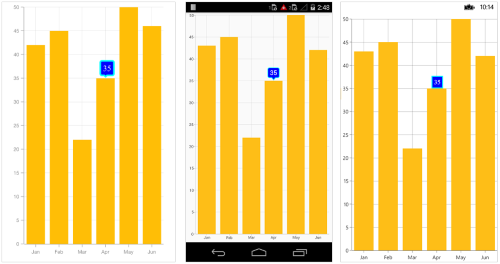
You can customize the tooltip label. For customizing, you need to add an instance of ChartTooltipBehavior to the ChartBehaviors collection property of SfChart. Following properties are used to customize the tooltip label which are available in ChartTooltipBehavior.
-
BorderColor– used to change the label border color -
BorderWidth– used to change the label border width -
BackgroundColor– used to change the label background color -
Margin– used to change label border thickness -
TextColor– used to change the text color. -
Font– used to change the text size, font family, and font weight. (This is deprecated API. Use FontSize, FontFamily, and FontAttributes properties instead of this.) -
FontFamily- used to change the font family for the tooltip text. -
FontAttributes- used to change the font style for the tooltip text. -
FontSize- used to change the font size for the tooltip text. -
LabelFormat– used to format the label -
Duration– used to set the visible duration of label -
OffsetX– used to move the label horizontally -
OffsetY– used to move the label vertically
<chart:SfChart.ChartBehaviors>

	<chart:ChartTooltipBehavior BackgroundColor="Blue" BorderWidth="3" BorderColor="Aqua" TextColor="White" Margin="5" Duration="10"  FontSize="15" FontFamily="Times New Roman"/>

	</chart:ChartTooltipBehavior>

</chart:SfChart.ChartBehaviors>
SfChart chart = new SfChart();
...
ChartTooltipBehavior tool = new ChartTooltipBehavior();
tool.BackgroundColor = Color.Blue;
tool.BorderWidth = 3;
tool.BorderColor = Color.Aqua;
tool.TextColor = Color.White;
tool.Margin = new Thickness(5, 5, 5, 5);
tool.Duration = 10;
tool.FontSize = 15;
tool.FontFamily = "Times New Roman";
chart.ChartBehaviors.Add(tool);
Tooltip Template
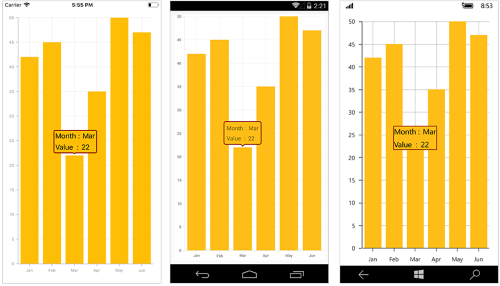
You can customize the appearance of the tooltip with your own template by using the TooltipTemplate property of Series. The BindingContext in the data template will be the respective underlying object from ItemsSource.
<chart:ColumnSeries ItemsSource="{Binding Data}" XBindingPath="Month" YBindingPath="Value" EnableTooltip="True">
                    <chart:ColumnSeries.TooltipTemplate>
                        <DataTemplate>
                            <StackLayout Orientation="Vertical">
                                <StackLayout Orientation="Horizontal">
                                    <Label Text="Month :" />
                                    <Label Text="{Binding Month}"/>
                                </StackLayout>
                                <StackLayout Orientation="Horizontal">
                                    <Label Text="Value   :" />
                                    <Label Text="{Binding Value}"/>
                                </StackLayout>
                            </StackLayout>
                        </DataTemplate>
                    </chart:ColumnSeries.TooltipTemplate>
</chart:ColumnSeries>
<chart:SfChart.ChartBehaviors>
   <chart:ChartTooltipBehavior BorderWidth="3" BorderColor="Maroon"/>
</chart:SfChart.ChartBehaviors>
ColumnSeries column = new ColumnSeries();
column.ItemsSource = viewModel.Data;
column.XBindingPath = "Month";
column.YBindingPath = "Value";
column.EnableTooltip = true;
ChartTooltipBehavior tooltip = new ChartTooltipBehavior();
tooltip.BorderColor = Color.Maroon;
tooltip.BorderWidth = 3 ;
chart.ChartBehaviors.Add(tooltip);
DataTemplate template = new DataTemplate(() =>
{
StackLayout stack = new StackLayout() { Orientation = StackOrientation.Vertical };
StackLayout first = new StackLayout() { Orientation = StackOrientation.Horizontal };
Label label = new Label() { Text = "Month:" };
Label xValue = new Label();
xValue.SetBinding(Label.TextProperty, new Binding("Month"));
first.Children.Add(label);
first.Children.Add(xValue);
StackLayout second = new StackLayout() { Orientation = StackOrientation.Horizontal };
Label label1 = new Label() { Text = "Value:" };
Label yValue = new Label();
yValue.SetBinding(Label.TextProperty, "Value");
second.Children.Add(label1);
second.Children.Add(yValue);
stack.Children.Add(first);
stack.Children.Add(second);
return stack;
});
column.TooltipTemplate = template;
chart.Series.Add(column);
Methods
You can show or hide the chart tooltip programmatically by using the show or hide method.
Show method
The Show method is used to activate the tooltip at the specified location.
<Button Text="Show tooltip" Clicked="ShowTooltip" />

. . .

<chart:SfChart.ChartBehaviors>
    <chart:ChartTooltipBehavior x:Name="tooltipBehavior" />
</chart:SfChart.ChartBehaviors>public partial class MainPage : ContentPage
{
public MainPage()
{
InitializeComponent();
}
private void ShowTooltip(object sender, EventArgs e)
{
//pointX - determines the x position of tooltip, pointY - determines the y position of tooltip and bool value determines whether the tooltip should be animated while displaying.
tooltipBehavior.Show(pointX, pointY, true);
}
}NOTE
The tooltip will be activated at the specified location only if there is any data point under the specified location.
Hide method
The Hide method is used to hide the tooltip programmatically.
//The argument determines whether the tooltip should be animated while hiding.

tooltip.Hide(true);
NOTE
You can refer to our Xamarin Charts feature tour page for its groundbreaking feature representations. You can also explore our Xamarin.Forms Charts example to knows various chart types and how to easily configured with built-in support for creating stunning visual effects.
See also
How to bind the Xamarin.Forms pie chart tooltip to “Others” category values