Annotations in Xamarin Charts (SfChart)
6 Jan 202524 minutes to read
SfChart supports annotations which allows you to mark the specific area of interest in the chart area. You can add text, images, and custom views.
The following annotations are supported in SfChart:
- Text annotation
- Shape annotation
- View annotation
Adding Annotations
You can create an instance for any type of annotations and it can be added to ChartAnnotations collection. Here for an instance, the EllipseAnnotation is added.
<chart:SfChart>
...

    <chart:SfChart.ChartAnnotations>

        <chart:EllipseAnnotation X1="2" Y1="35" X2="6" Y2="40" Text="Ellipse" />

    </chart:SfChart.ChartAnnotations>

</chart:SfChart>
SfChart chart = new SfChart();
...
EllipseAnnotation annotation = new EllipseAnnotation()
{
X1 = 2,
Y1 = 35,
X2 = 6,
Y2 = 40,
Text = "Ellipse"
};
chart.ChartAnnotations.Add(annotation);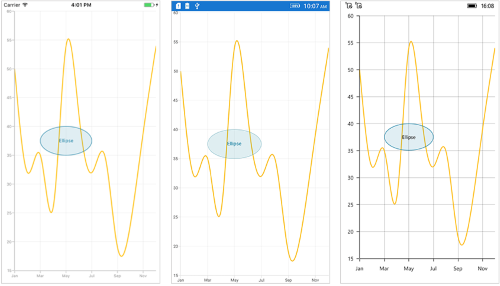
Positioning the annotation
Annotations can be positioned in plot area based on X1 and Y1 properties. For shape annotations, specify X2 and Y2 properties, if needed. The X and Y values can be specified with axis units or pixel units, and these can be identified by using CoordinateUnit property.
Positioning based on CoordinateUnit as axis
To position the annotation based on axis, set the X1 and Y1, X2 and Y2 properties based on axis range values, if needed, set the CoordinateUnit value as Axis.
<chart:SfChart>
...

    <chart:SfChart.ChartAnnotations>

        <chart:RectangleAnnotation X1="4" Y1="40" X2="8" Y2="45" Text="Axis Value" CoordinateUnit="Axis" />

    </chart:SfChart.ChartAnnotations>

</chart:SfChart>
SfChart chart = new SfChart();
...
RectangleAnnotation annotation = new RectangleAnnotation()
{
X1 = 4,
Y1 = 40,
X2 = 8,
Y2 = 45,
Text = "Axis Value",
CoordinateUnit = ChartCoordinateUnit.Axis
};
chart.ChartAnnotations.Add(annotation);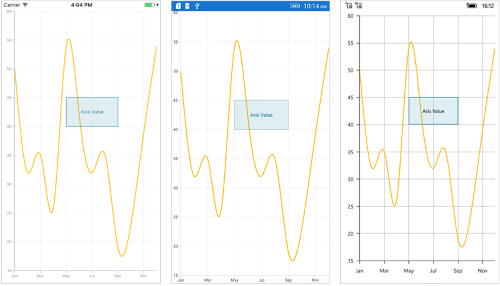
Positioning based on CoordinateUnit as pixels
To position the annotation based on the pixel values, set the CoordinateUnit value as Pixels, and the pixel values in X1 and Y1, X2 and Y2 properties of annotation are shown in the following code snippet,
<chart:SfChart>
...

    <chart:SfChart.ChartAnnotations>

        <chart:RectangleAnnotation X1="1" Y1="1" X2="150" Y2="150" Text="Pixel Value" CoordinateUnit="Pixels" />

    </chart:SfChart.ChartAnnotations>

</chart:SfChart>
SfChart chart = new SfChart();
...
RectangleAnnotation annotation = new RectangleAnnotation()
{
X1 = 1,
Y1 = 1,
X2 = 150,
Y2 = 150,
Text = "Pixel Value",
CoordinateUnit = ChartCoordinateUnit.Pixels
};
chart.ChartAnnotations.Add(annotation);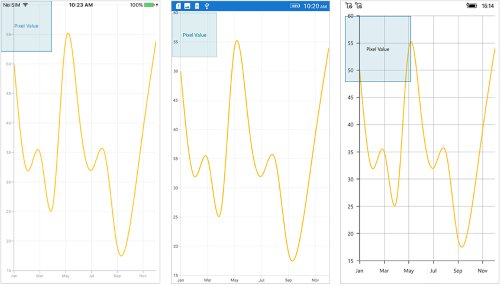
Adding annotation for multiple axes
When there are multiple axes, annotation also can be added for a particular axis by using the XAxisName and YAxisName properties. It can be shown in the below code snippet,
<chart:SfChart>
...

    <chart:SfChart.ChartAnnotations>

        <chart:EllipseAnnotation X1="4" Y1="30" X2="8" Y2="35" YAxisName="Yaxis"/>

    </chart:SfChart.ChartAnnotations>

    <chart:SfChart.Series>

        <chart:SplineSeries ItemsSource="{Binding Data}" XBindingPath="Name" YBindingPath="Value">

            <chart:SplineSeries.YAxis>

                <chart:NumericalAxis Name="Yaxis" OpposedPosition="true"/>

            </chart:SplineSeries.YAxis>

        </chart:SplineSeries>

    </chart:SfChart.Series>

</chart:SfChart>
SfChart chart = new SfChart();
...
EllipseAnnotation annotation = new EllipseAnnotation()
{
X1 = 4,
Y1 = 30,
X2 = 8,
Y2 = 35,
YAxisName = "YAxis"
};
chart.ChartAnnotations.Add(annotation);
SplineSeries series = new SplineSeries()
{
ItemsSource = model.Data,
XBindingPath = "Name",
YBindingPath = "Value",
YAxis = new NumericalAxis()
{
OpposedPosition = true,
Name = "YAxis"
}
};
chart.Series.Add(series);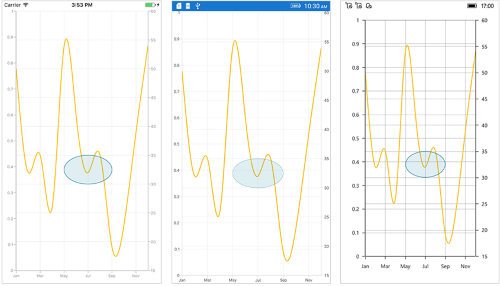
Text annotation
The TextAnnotation is used to add simple text with the help of Text property in specific points over the Chart area.
<chart:SfChart>
...

    <chart:SfChart.ChartAnnotations>

        <chart:TextAnnotation X1="7" Y1="35" Text="August" />

    </chart:SfChart.ChartAnnotations>

</chart:SfChart>
SfChart chart = new SfChart();
...
TextAnnotation annotation = new TextAnnotation()
{
X1 = 7,
Y1 = 35,
Text = "August"
};
chart.ChartAnnotations.Add(annotation);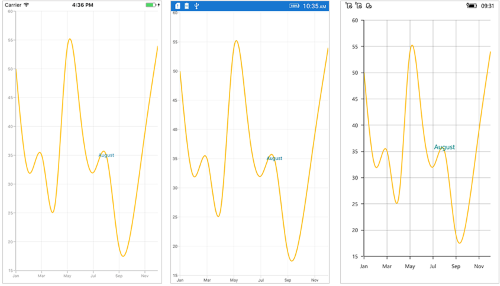
Customizing text annotation
The TextAnnotation can be customized by using the LabelStyle property. The following properties are used to customize the text:
-
TextColor- Used to change the text color. -
BackgroundColor- Used to change the background color of the text. -
Margin- Used to set the margin for text. -
BorderThickness- Used to change the text border thickness. -
BorderColor- Used to change the border color of the text. -
Font– used to change the text size, font family, and font weight. (This is deprecated API. Use FontSize, FontFamily, and FontAttributes properties instead of this.) -
FontFamily- used to change the font family of the text. -
FontAttributes- used to change the font style of the text. -
FontSize- used to change the font size of the text. -
HorizontalTextAlignment- Used to align the text horizontally at theStart,CenterandEnd. -
VerticalTextAlignment- Used to align the text vertically at theStart,CenterandEnd.
<chart:SfChart>
...

    <chart:SfChart.ChartAnnotations>

        <chart:TextAnnotation X1="7" Y1="35" Text="August">

            <chart:TextAnnotation.LabelStyle>

                <chart:ChartAnnotationLabelStyle Margin="5" FontSize="16" FontAttributes="Italic" BorderColor="Red" BorderThickness="2" BackgroundColor="Teal" TextColor="White" VerticalTextAlignment="Start"/>

            </chart:TextAnnotation.LabelStyle>

        </chart:TextAnnotation>

    </chart:SfChart.ChartAnnotations>

</chart:SfChart>
SfChart chart = new SfChart();
...
TextAnnotation annotation = new TextAnnotation()
{
X1 = 7,
Y1 = 35,
Text = "August"
};
annotation.LabelStyle = new ChartAnnotationLabelStyle()
{
Margin = new Thickness(5),
FontSize = 16,
FontAttributes = FontAttributes.Italic,
BorderColor = Color.Red,
BorderThickness = new Thickness(2),
BackgroundColor = Color.Teal,
TextColor = Color.White,
VerticalTextAlignment = ChartAnnotationAlignment.Start
};
chart.ChartAnnotations.Add(annotation);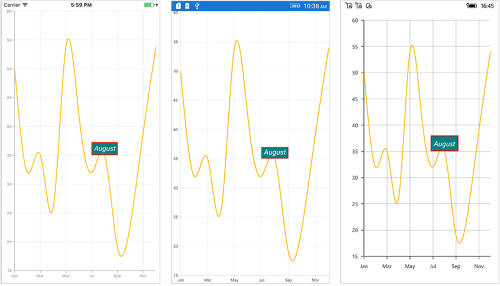
Shape annotation
The ShapeAnnotation allows you to add annotations in the form of shapes such as rectangle, ellipse, horizontal line, vertical line, etc., at the specific area of interest in the chart area.
-
RectangleAnnotation- Used to draw a rectangle over the chart area. -
EllipseAnnotation- Used to draw a circle or an ellipse over the chart area. -
LineAnnotation- Used to draw a line over the chart area. -
VerticalLineAnnotation- Used to draw a vertical line across the chart area. -
HorizontalLineAnnotation- Used to draw a horizontal line across the chart area.
The following APIs are commonly used in all ShapeAnnotation:
-
X2- Represents the X2 coordinate of the shape annotation. -
Y2- Represents the Y2 coordinate of the shape annotation. -
FillColor- Represents the inside background color of the shape annotation. -
StrokeColor- Represents the stroke color of the shape annotation. -
StrokeWidth- Represents the stroke width of the shape annotation. -
StrokeDashArray- Represents the stroke dashes of the shape annotation. -
Text- Represents the annotation text of the shape annotation. -
LabelStyle- Represents the style for customizing the annotation text of shape annotation.
Rectangle annotation
The RectangleAnnotation is used to draw a rectangle or a square in specific points over the chart area.
<chart:SfChart>
...

    <chart:SfChart.ChartAnnotations>

        <chart:RectangleAnnotation X1="4" Y1="20" X2="6" Y2="55"/>

    </chart:SfChart.ChartAnnotations>

</chart:SfChart>
SfChart chart = new SfChart();
...
RectangleAnnotation annotation = new RectangleAnnotation()
{
X1 = 4,
Y1 = 20,
X2 = 6,
Y2 = 55,
};
chart.ChartAnnotations.Add(annotation);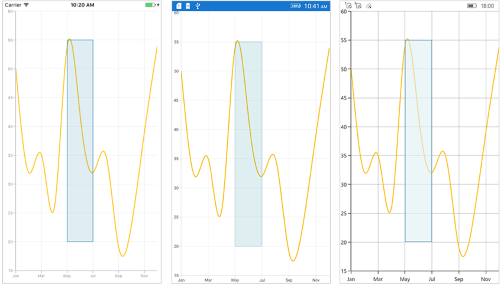
Ellipse annotation
The EllipseAnnotation is used to draw an oval or a circle in specific points over the chart area. You can also specify the height and width of EllipseAnnotation by using the Height and Width properties respectively.
<chart:SfChart>
...

    <chart:SfChart.ChartAnnotations>

        <chart:EllipseAnnotation X1="6" Y1="32" Height="30" Width="30"/>

    </chart:SfChart.ChartAnnotations>

</chart:SfChart>
SfChart chart = new SfChart();
...
EllipseAnnotation annotation = new EllipseAnnotation()
{
X1 = 6,
Y1 = 32,
Height = 30,
Width = 30
};
chart.ChartAnnotations.Add(annotation);NOTE
When
X2andY2properties ofEllipseAnnotationare set, theHeightandWidthproperties do not work.
Line annotation
The LineAnnotation is used to draw a line in specific points over the chart area.
<chart:SfChart>
...

    <chart:SfChart.ChartAnnotations>

        <chart:LineAnnotation X1="2" Y1="35" X2="8" Y2="45" Text="Line"/>

    </chart:SfChart.ChartAnnotations>

</chart:SfChart>
SfChart chart = new SfChart();
...
LineAnnotation annotation = new LineAnnotation()
{
X1 = 2,
Y1 = 35,
X2 = 8,
Y2 = 45,
Text = "Line"
};
chart.ChartAnnotations.Add(annotation);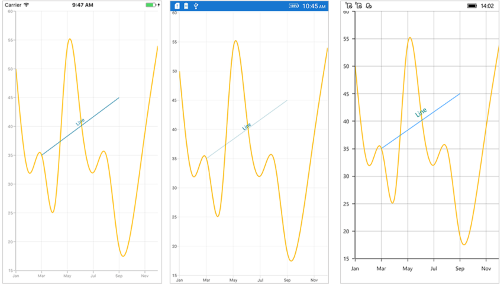
Adding arrow to line annotation
To display single headed arrow, set the LineCap property to Arrow. The default value of the LineCap property is None.
<chart:SfChart>
...

    <chart:SfChart.ChartAnnotations>

        <chart:LineAnnotation X1="2" Y1="40" X2="10" Y2="40" LineCap="Arrow"/>

    </chart:SfChart.ChartAnnotations>

</chart:SfChart>
SfChart chart = new SfChart();
...
LineAnnotation annotation = new LineAnnotation()
{
X1 = 2,
Y1 = 40,
X2 = 10,
Y2 = 40,
LineCap = ChartLineCap.Arrow
};
chart.ChartAnnotations.Add(annotation);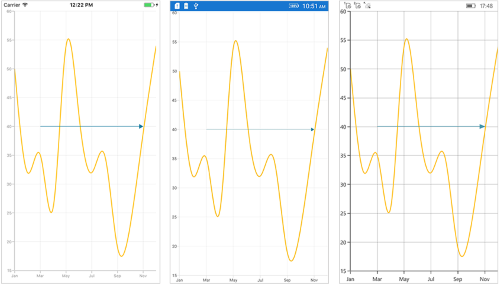
Vertical and Horizontal line annotation
The VerticalLineAnnotation and HorizontalLineAnnotation are used to draw vertical and horizontal lines in specific points over the chart area.
<chart:SfChart>
...

    <chart:SfChart.ChartAnnotations>

        <chart:VerticalLineAnnotation X1="6" />

        <chart:HorizontalLineAnnotation Y1="35" />

    </chart:SfChart.ChartAnnotations>

</chart:SfChart>
SfChart chart = new SfChart();
...
VerticalLineAnnotation vertical = new VerticalLineAnnotation()
{
X1 = 6,
};
chart.ChartAnnotations.Add(vertical);
HorizontalLineAnnotation horizontal = new HorizontalLineAnnotation()
{
Y1 = 35
};
chart.ChartAnnotations.Add(horizontal);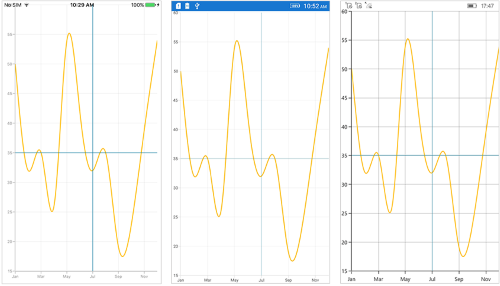
Displaying axis label for vertical and horizontal line annotations
The VerticalLineAnnotation and HorizontalLineAnnotation display the axis labels in which the line is placed. This feature can be enabled by setting the ShowAxisLabel property to true as shown in the below code snippet,
<chart:SfChart>
...

    <chart:SfChart.ChartAnnotations>

        <chart:VerticalLineAnnotation X1="6" ShowAxisLabel="true"/>

        <chart:HorizontalLineAnnotation Y1="35" ShowAxisLabel="true"/>

    </chart:SfChart.ChartAnnotations>

</chart:SfChart>
SfChart chart = new SfChart();
...
VerticalLineAnnotation vertical = new VerticalLineAnnotation()
{
X1 = 6,
ShowAxisLabel = true
};
chart.ChartAnnotations.Add(vertical );
HorizontalLineAnnotation horizontal = new HorizontalLineAnnotation()
{
Y1 = 35,
ShowAxisLabel = true
};
chart.ChartAnnotations.Add(horizontal);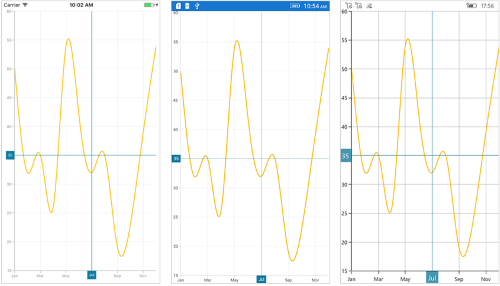
Customizing axis label
The default appearance of the axis label also can be customized by using the AxisLabelStyle property. The following 2 types of styles are used to customize the axis label.
The ChartLabelStyle property allows you to customize the axis labels by changing the font family, font size, font attributes, and text color. It is the AxisLabelStyle property’s default style. The following properties can be used to customize the axis label:
-
TextColor- Used to change the text color. -
BackgroundColor- Used to change the background color of the text. -
Margin- Used to set the margin for text. -
BorderThickness- Used to change the text border thickness. -
BorderColor- Used to change the border color of the text. -
Font– used to change the text size, font family, and font weight. (This is deprecated API. Use FontSize, FontFamily, and FontAttributes properties instead of this.) -
FontFamily- used to change the font family for the text. -
FontAttributes- used to change the font style for the text. -
FontSize- used to change the font size for the text.
<chart:SfChart>
...

    <chart:SfChart.ChartAnnotations>

        <chart:VerticalLineAnnotation X1="6" ShowAxisLabel="true">

            <chart:VerticalLineAnnotation.AxisLabelStyle>

                <chart:ChartLabelStyle Margin="5" FontSize="12" FontAttributes="Italic" BorderColor="Blue" BorderThickness="2" BackgroundColor="Red" TextColor="White"/>

            </chart:VerticalLineAnnotation.AxisLabelStyle>

        </chart:VerticalLineAnnotation>

        <chart:HorizontalLineAnnotation Y1="35" ShowAxisLabel="true">

            <chart:HorizontalLineAnnotation.AxisLabelStyle>

                <chart:ChartLabelStyle Margin="5" FontSize="12" FontAttributes="Italic" BorderColor="Blue" BorderThickness="2" BackgroundColor="Red" TextColor="White"/>

            </chart:HorizontalLineAnnotation.AxisLabelStyle>

        </chart:HorizontalLineAnnotation>

    </chart:SfChart.ChartAnnotations>

</chart:SfChart>
SfChart chart = new SfChart();
...
VerticalLineAnnotation vertical = new VerticalLineAnnotation()
{
X1 = 6,
ShowAxisLabel = true
};
vertical.AxisLabelStyle = new ChartLabelStyle()
{
Margin = new Thickness(5),
FontSize = 12,
FontAttributes = FontAttributes.Italic,
BorderColor = Color.Blue,
BorderThickness = new Thickness(2),
BackgroundColor = Color.Red,
TextColor = Color.White
};
chart.ChartAnnotations.Add(vertical);
HorizontalLineAnnotation horizontal = new HorizontalLineAnnotation()
{
Y1 = 35,
ShowAxisLabel = true
};
horizontal.AxisLabelStyle = new ChartLabelStyle()
{
Margin = new Thickness(5),
FontSize = 12,
FontAttributes = FontAttributes.Italic,
BorderColor = Color.Blue,
BorderThickness = new Thickness(2),
BackgroundColor = Color.Red,
TextColor = Color.White
};
chart.ChartAnnotations.Add(horizontal);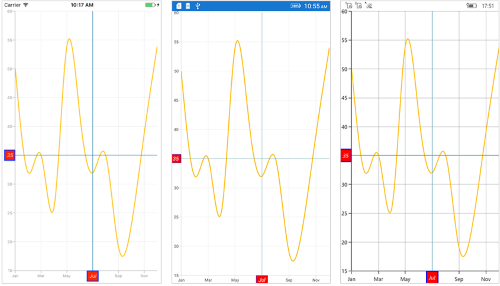
The ChartAxisLabelStyle allows you to customize axis label by changing the label alignment, label position, corner radius, and max width. And also, customizing the Font family, font size, font attributes, and text color are all included in the ChartLabelStyle properties. The following properties can be used to customize the axis label:
-
LabelAlignment- Used to align the label at the start, center, or end. -
LabelsPosition- Used to position the text atInsideorOutsideof the chart axis. By default, the text will be positioned outside the chart axis. -
CornerRadius- Used to change the corner radius of the background. -
MaxWidth- Provides the maximum text width of the axis label and wraps to the next line when exceeds the maximum width. -
WrappedLabelAlignment- Positions the wrapped text at the start, center, or end. The default value of theWrappedLabelAlignmentproperty is set toStart.
<chart:SfChart>
...

    <chart:SfChart.ChartAnnotations>

        <chart:VerticalLineAnnotation X1="6" ShowAxisLabel="true">

            <chart:VerticalLineAnnotation.AxisLabelStyle>

                <chart:ChartAxisLabelStyle Margin="5" FontSize="12" FontAttributes="Italic" BorderColor="Blue" BorderThickness="2" BackgroundColor="Red" TextColor="White" CornerRadius="5"/>

            </chart:VerticalLineAnnotation.AxisLabelStyle>

        </chart:VerticalLineAnnotation>

        <chart:HorizontalLineAnnotation Y1="35" ShowAxisLabel="true">

            <chart:HorizontalLineAnnotation.AxisLabelStyle>

                <chart:ChartAxisLabelStyle Margin="5" FontSize="12" FontAttributes="Italic" BorderColor="Blue" BorderThickness="2" BackgroundColor="Red" TextColor="White" LabelAlignment="Start"/>

            </chart:HorizontalLineAnnotation.AxisLabelStyle>

        </chart:HorizontalLineAnnotation>

    </chart:SfChart.ChartAnnotations>

</chart:SfChart>
SfChart chart = new SfChart();
...
VerticalLineAnnotation vertical = new VerticalLineAnnotation()
{
X1 = 6,
ShowAxisLabel = true
};
vertical.AxisLabelStyle = new ChartAxisLabelStyle()
{
Margin = new Thickness(5),
FontSize = 12,
FontAttributes = FontAttributes.Italic,
BorderColor = Color.Blue,
BorderThickness = new Thickness(2),
BackgroundColor = Color.Red,
TextColor = Color.White,
CornerRadius = new ChartCornerRadius(5)
};
chart.ChartAnnotations.Add(vertical);
HorizontalLineAnnotation horizontal = new HorizontalLineAnnotation()
{
Y1 = 35,
ShowAxisLabel = true
};
horizontal.AxisLabelStyle = new ChartAxisLabelStyle()
{
Margin = new Thickness(5),
FontSize = 12,
FontAttributes = FontAttributes.Italic,
BorderColor = Color.Blue,
BorderThickness = new Thickness(2),
BackgroundColor = Color.Red,
TextColor = Color.White,
LabelAlignment = ChartAxisLabelAlignment.Start
};
chart.ChartAnnotations.Add(horizontal);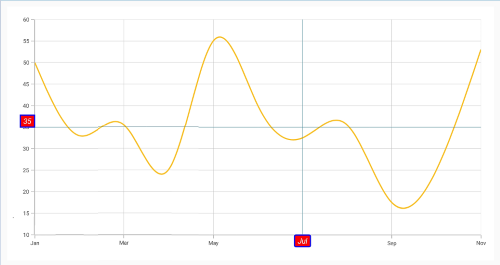
Adding arrow to vertical and horizontal line annotations
To display the single headed arrow, set the LineCap property to Arrow. The default value of the LineCap property is None.
<chart:SfChart>
...

    <chart:SfChart.ChartAnnotations>

        <chart: VerticalLineAnnotation X1="6" LineCap="Arrow"/>

        <chart:HorizontalLineAnnotation Y1="35" LineCap="Arrow"/>

    </chart:SfChart.ChartAnnotations>

</chart:SfChart>
SfChart chart = new SfChart();
...
VerticalLineAnnotation vertical = new VerticalLineAnnotation()
{
X1 = 6,
LineCap = ChartLineCap.Arrow
};
chart.ChartAnnotations.Add(vertical );
HorizontalLineAnnotation horizontal = new HorizontalLineAnnotation()
{
Y1 = 35,
LineCap = ChartLineCap.Arrow
};
chart.ChartAnnotations.Add(horizontal);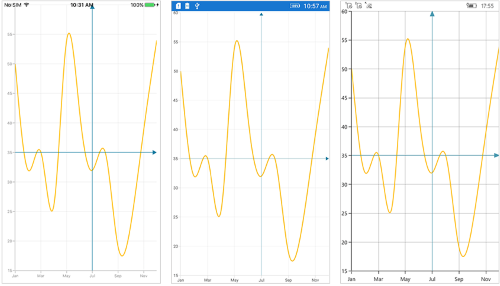
Adding text in shape annotation
For all the shape annotations, the text can be displayed by using the Text property.
Customizing text in shape annotation
The Text in shape annotation also can be customized by using the LabelStyle property. The following properties are used to customize the text:
-
TextColor- Used to change the text color. -
BackgroundColor- Used to change the background color of the text. -
Margin- Used to set the margin for text. -
BorderThickness- Used to change the text border thickness. -
BorderColor- Used to change the text border color. -
Font– used to change the text size, font family, and font weight. (This is deprecated API. Use FontSize, FontFamily, and FontAttributes properties instead of this.) -
FontFamily- used to change the font family for the text. -
FontAttributes- used to change the font style for the text. -
FontSize- used to change the font size for the text. -
HorizontalTextAlignment- Used to align the text horizontally. -
VerticalTextAlignment- Used to align the text vertically.
<chart:SfChart>
...

    <chart:SfChart.ChartAnnotations>

        <chart:EllipseAnnotation X1="2" Y1="30" X2="6" Y2="35" Text="Ellipse" >

            <chart:EllipseAnnotation.LabelStyle>

                <chart:ChartAnnotationLabelStyle Margin="5" FontSize="16" FontAttributes="Italic" BorderColor="Red" BorderThickness="2" BackgroundColor="Blue" TextColor="White"/>

            </chart:EllipseAnnotation.LabelStyle>

        </chart:EllipseAnnotation>

    </chart:SfChart.ChartAnnotations>

</chart:SfChart>
SfChart chart = new SfChart();
...
EllipseAnnotation annotation = new EllipseAnnotation()
{
X1 = 2,
Y1 = 30,
X2 = 6,
Y2 = 35,
Text = "Ellipse"
};
annotation.LabelStyle = new ChartAnnotationLabelStyle()
{
Margin = new Thickness(5),
FontSize = 16,
FontAttributes = FontAttributes.Italic,
BorderColor = Color.Red,
BorderThickness = new Thickness(2),
BackgroundColor = Color.Blue,
TextColor = Color.White,
};
chart.ChartAnnotations.Add(annotation);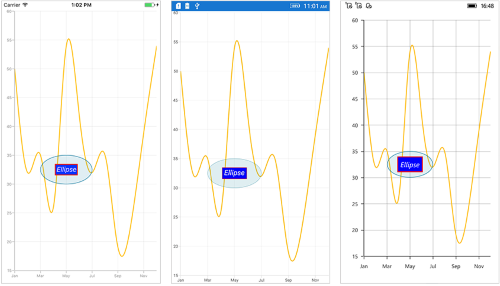
View annotation
The ViewAnnotation allows you to add annotations in the form of own custom view with the help of View property at the specific area of interest in the chart area. The ViewAnnotation also can be aligned by using the VerticalAlignment and HorizontalAlignment properties.
<chart:SfChart>
...

    <chart:SfChart.ChartAnnotations>

        <chart:ViewAnnotation X1="3" Y1="12" VerticalAlignment="Start" >

            <chart:ViewAnnotation.View>

                <StackLayout>

                    <Image Source="Graduate.png" WidthRequest="70" HeightRequest="70" />

                </StackLayout>

            </chart:ViewAnnotation.View>

        </chart:ViewAnnotation>

    </chart:SfChart.ChartAnnotations>

</chart:SfChart>
SfChart chart = new SfChart();
...
ViewAnnotation annotation = new ViewAnnotation()
{
X1 = 3,
Y1 = 12,
VerticalAlignment = ChartAnnotationAlignment.Start
};
StackLayout layout = new StackLayout();
Image image = new Image();
image.Source = "Graduate.png";
image.HeightRequest = 70;
image.WidthRequest = 70;
layout.Children.Add(image);
annotation.View = layout;
chart.ChartAnnotations.Add(annotation);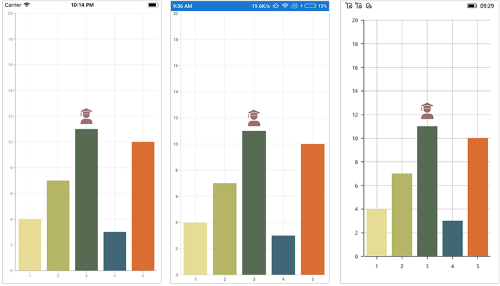
Annotation Visibility
The IsVisible property of ChartAnnotation is used to toggle the visibility of annotation.
<chart:SfChart.ChartAnnotations>
    <chart:VerticalLineAnnotation IsVisible="False" X1="2" LineCap="Arrow" ShowAxisLabel="true" Text="Vertical Line" x:Name="verticalLineAnnotation" />
</chart:SfChart.ChartAnnotations>
VerticalLineAnnotation verticalLineAnnotation = new VerticalLineAnnotation()
{
IsVisible = false
};
chart.ChartAnnotations.Add(verticalLineAnnotation);Event
AnnotationClicked
The AnnotationClicked event is triggered when the user has clicked the annotation. The argument contains the following information.
-
Annotation– used to get the instance of annotation which is clicked. -
X– used to get the x position of touch point on annotation. -
Y– used to get the y position of touch point on annotation..
Get the touch position in annotation
Following are the override methods that are available in annotation to send the information about touch interactions.
-
OnTouchDown– occurs when touch down inside the annotation. -
OnTouchMove– occurs while moving the finger or mouse inside the annotation. -
OnTouchUp– occurs when touch up inside the annotation.
public class TextAnnotationExt : TextAnnotation
{
    protected override void OnTouchDown(float pointX, float pointY)
    {
       base.OnTouchDown(pointX, pointY);
    }

    protected override void OnTouchMove(float pointX, float pointY)
    {
       base.OnTouchMove(pointX, pointY);
    }

    protected override void OnTouchUp(float pointX, float pointY)
    {
       base.OnTouchUp(pointX, pointY);
    }
}
NOTE
You can refer to our Xamarin Charts feature tour page for its groundbreaking feature representations. You can also explore our Xamarin.Forms Charts example to knows various chart types and how to easily configured with built-in support for creating stunning visual effects.