How can I help you?
Appearance in Xamarin Charts (SfChart)
6 Jan 202517 minutes to read
Apply palette for Chart
ColorModel property of SfChart is used to define the colors for each series. ColorModel contains the following color palettes.
Predefined Palettes
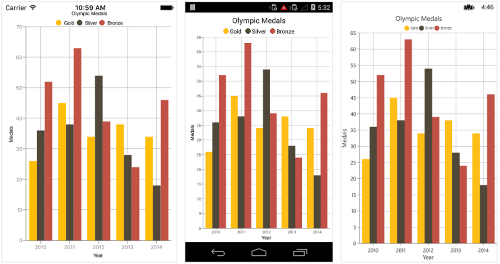
Currently, Chart supports only Metro palette and it is the default palette for SfChart. The following screenshot shows the default appearance of multiple series.
Custom Palette
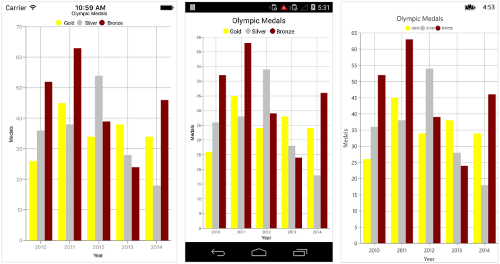
Chart will use the colors from CustomBrushes property if ColorModel.Palette is set to Custom.
Following code illustrates how to set the custom colors.
<ContentPage.Resources>
    <ResourceDictionary>
        <chart:ChartColorCollection x:Key="Colors">
                <Color>Yellow</Color>
                <Color>Gray</Color>
                <Color>Maroon</Color>
            </chart:ChartColorCollection>
    </ResourceDictionary>
</ContentPage.Resources>

<chart:SfChart>
    <chart:SfChart.ColorModel>
        <chart:ChartColorModel Palette="Custom" CustomBrushes="{StaticResource Colors}"/>
    </chart:SfChart.ColorModel>

    ...
</chart:SfChart>
SfChart chart = new SfChart()
{
ColorModel = new ChartColorModel()
{
Palette = ChartColorPalette.Custom,
CustomBrushes = new ChartColorCollection()
{
Color.Yellow,
Color.Gray,
Color.Maroon
}
},
...
};
None Palette
None palette will not apply any color to the series. So in order to define the color for any series, you can use the Color property or the ColorModel property of ChartSeries (The ColorModel of Series will be explained later in this document).
Apply palette for Series
ColorModel property of ChartSeries is used to define the colors for each data point. Following palettes are used to define the colors.
Predefined Palettes
Currently, Chart supports only Metro palette.
<chart:SfChart>
...

	<chart:ColumnSeries ItemsSource ="{Binding Data}" XBindingPath="Country" YBindingPath="Value">

		<chart:ColumnSeries.ColorModel>

			<chart:ChartColorModel Palette="Metro"/>

		</chart:ColumnSeries.ColorModel>

	</chart:ColumnSeries>

</chart:SfChart>
SfChart chart = new SfChart();
...
ColumnSeries columnSeries = new ColumnSeries() {
ItemsSource = Data,
XBindingPath = "Country",
YBindingPath = "Value"
};
columnSeries.ColorModel.Palette = ChartColorPalette.Metro;
chart.Series.Add(columnSeries);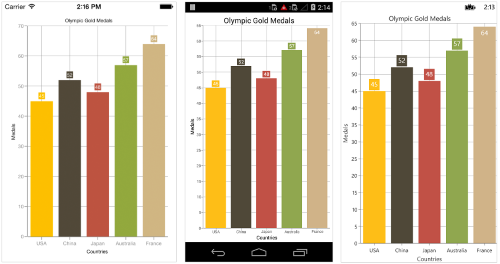
NOTE
The single line segment rendered based on the two data points. Since, each color in the ColorModel has been applied to their segments by combining it with two data points for all types of line series.
Custom Palette
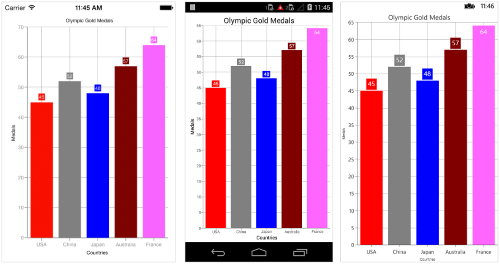
Series will use the colors from CustomBrushes property if the ColorModel.Palette property of series is set to Custom.
Following code illustrates how to set the custom colors.
<ContentPage.Resources>
    <ResourceDictionary>
        <chart:ChartColorCollection x:Key="Colors">
             <Color>Red</Color>
             <Color>Gray</Color>
             <Color>Blue</Color>
             <Color>Maroon</Color>
             <Color>Pink</Color>
        </chart:ChartColorCollection>
    </ResourceDictionary>
</ContentPage.Resources>

<chart:SfChart>
    ...
    <chart:SfChart.Series>
        <chart:ColumnSeries ItemsSource="{Binding Data}" XBindingPath="Name" YBindingPath="Height">
            <chart:ColumnSeries.ColorModel>
                <chart:ChartColorModel Palette="Custom" CustomBrushes="{StaticResource Colors}"/>
            </chart:ColumnSeries.ColorModel>
        </chart:ColumnSeries>
    </chart:SfChart.Series>
</chart:SfChart>
SfChart chart = new SfChart()
{
...
Series =
{
new ColumnSeries()
{
ItemsSource = viewModel.Data,
XBindingPath = "Name",
YBindingPath = "Height",
ColorModel = new ChartColorModel()
{
Palette = ChartColorPalette.Custom,
CustomBrushes = new ChartColorCollection()
{
Color.Red,
Color.Gray,
Color.Blue,
Color.Maroon,
Color.Pink,
}
}
}
}
};
None Palette
None palette will not apply any color to the data points. So in order to define the color for the data points, you can use the Color property of ChartSeries.
Gradient Colors
The CustomGradientColors property of ChartColorModel is used to define the gradient colors, the colors from this property is used for series or chart if the Palette property of ChartColorModel is Custom and the CustomBrushes property is null. The following properties are used to define the gradient color for the chart.
The StartPoint and EndPoint properties of ChartGradientColor is used to configure the direction of gradient color, GradientStops property is used to set the color based on the offset.
The Color and Offset properties of ChartGradientStop is used to configure the color and offset position of each color.
Following code snippets and screenshot illustrates how to apply the gradient color to the chart series.
<chart:ColumnSeries.ColorModel>
          <chart:ChartColorModel Palette="Custom">
            <chart:ChartColorModel.CustomGradientColors>
              <chart:ChartGradientColor StartPoint="0.5,1" EndPoint="0.5, 0">
                <chart:ChartGradientColor.GradientStops>
                  <chart:ChartGradientStop Color="#FFE7C7" Offset= "0"/>
                  <chart:ChartGradientStop Color="#FCB69F" Offset= "1"/>
                </chart:ChartGradientColor.GradientStops>
              </chart:ChartGradientColor>
              <chart:ChartGradientColor StartPoint="0.5,1" EndPoint="0.5, 0">
                <chart:ChartGradientColor.GradientStops>
                  <chart:ChartGradientStop Color="#DCFA97" Offset= "0"/>
                  <chart:ChartGradientStop Color="#96E6A1" Offset= "1"/>
                </chart:ChartGradientColor.GradientStops>
              </chart:ChartGradientColor>
              <chart:ChartGradientColor StartPoint="0.5,1" EndPoint="0.5, 0">
                <chart:ChartGradientColor.GradientStops>
                  <chart:ChartGradientStop Color="#DDD6F3" Offset= "0"/>
                  <chart:ChartGradientStop Color="#FAACA8" Offset= "1"/>
                </chart:ChartGradientColor.GradientStops>
              </chart:ChartGradientColor>
              <chart:ChartGradientColor StartPoint="0.5,1" EndPoint="0.5, 0">
                <chart:ChartGradientColor.GradientStops>
                  <chart:ChartGradientStop Color="#A8EAEE" Offset= "0"/>
                  <chart:ChartGradientStop Color="#7BB0F9" Offset= "1"/>
                </chart:ChartGradientColor.GradientStops>
              </chart:ChartGradientColor>
            </chart:ChartColorModel.CustomGradientColors>
          </chart:ChartColorModel>
</chart:ColumnSeries.ColorModel>series.ColorModel.Palette = ChartColorPalette.Custom;
ChartGradientColor gradientColor1 = new ChartGradientColor() { StartPoint = new Point(0.5, 1), EndPoint = new Point(0.5, 0) };
ChartGradientStop stop1 = new ChartGradientStop() { Color = Color.FromHex("#FFE7C7"), Offset = 0 };
ChartGradientStop stop2 = new ChartGradientStop() { Color = Color.FromHex("#FCB69F"), Offset = 1 };
gradientColor1.GradientStops.Add(stop1);
gradientColor1.GradientStops.Add(stop2);
ChartGradientColor gradientColor2 = new ChartGradientColor() { StartPoint = new Point(0.5, 1), EndPoint = new Point(0.5, 0) };
ChartGradientStop stop21 = new ChartGradientStop() { Color = Color.FromHex("#DCFA97"), Offset = 0 };
ChartGradientStop stop22 = new ChartGradientStop() { Color = Color.FromHex("#96E6A1"), Offset = 1 };
gradientColor2.GradientStops.Add(stop21);
gradientColor2.GradientStops.Add(stop22);
ChartGradientColor gradientColor3 = new ChartGradientColor() { StartPoint = new Point(0.5, 1), EndPoint = new Point(0.5, 0) };
ChartGradientStop stop31 = new ChartGradientStop() { Color = Color.FromHex("#DDD6F3"), Offset = 0 };
ChartGradientStop stop32 = new ChartGradientStop() { Color = Color.FromHex("#FAACA8"), Offset = 1 };
gradientColor3.GradientStops.Add(stop31);
gradientColor3.GradientStops.Add(stop32);
ChartGradientColor gradientColor4 = new ChartGradientColor() { StartPoint = new Point(0.5, 1), EndPoint = new Point(0.5, 0) };
ChartGradientStop stop41 = new ChartGradientStop() { Color = Color.FromHex("#A8EAEE"), Offset = 0 };
ChartGradientStop stop42 = new ChartGradientStop() { Color = Color.FromHex("#7BB0F9"), Offset = 1 };
gradientColor4.GradientStops.Add(stop41);
gradientColor4.GradientStops.Add(stop42);
ChartGradientColorCollection gradientColors = new ChartGradientColorCollection()
{
gradientColor1,
gradientColor2,
gradientColor3,
gradientColor4
};
series.ColorModel.CustomGradientColors = gradientColors;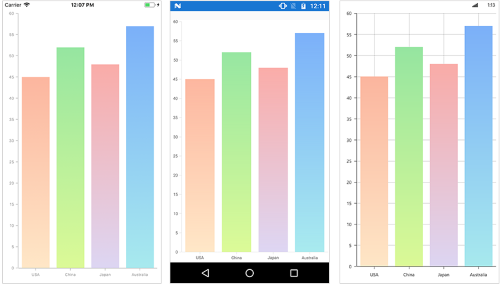
Following code snippet and screenshot illustrates how to apply the gradient color to the chart area.
<chart:SfChart.ColorModel>
      <chart:ChartColorModel Palette="Custom">
        <chart:ChartColorModel.CustomGradientColors>
          <chart:ChartGradientColor StartPoint="0.5,1" EndPoint="0.5,0">
            <chart:ChartGradientColor.GradientStops>
              <chart:ChartGradientStop Color="#FFE7C7" Offset= "0"/>
              <chart:ChartGradientStop Color="#FCB69F" Offset= "1"/>
            </chart:ChartGradientColor.GradientStops>
          </chart:ChartGradientColor>
        </chart:ChartColorModel.CustomGradientColors>
      </chart:ChartColorModel>
</chart:SfChart.ColorModel>chart.ColorModel.Palette = ChartColorPalette.Custom;
ChartGradientColor gradientColor = new ChartGradientColor() { StartPoint = new Point(0.5, 1), EndPoint = new Point(0.5, 0) };
ChartGradientStop stop1 = new ChartGradientStop() { Color = Color.FromHex("#FFE7C7"), Offset = 0 };
ChartGradientStop stop2 = new ChartGradientStop() { Color = Color.FromHex("#FCB69F"), Offset = 1 };
gradientColor.GradientStops.Add(stop1);
gradientColor.GradientStops.Add(stop2);
chart.ColorModel.CustomGradientColors.Add(gradientColor);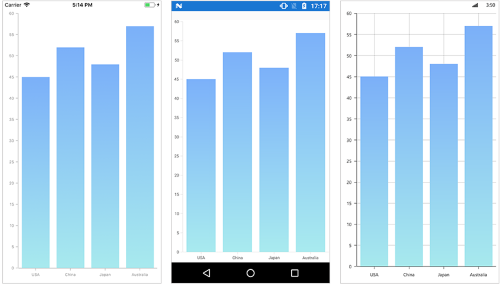
Plotting Area Customization
SfChart provides the AreaBorderColor, AreaBorderWidth, and AreaBackgroundColor properties to customize the plot area.
The following code samples demonstrate the usage of these properties:
<chart:SfChart

AreaBackgroundColor="Cyan"

AreaBorderColor="Gray"

AreaBorderWidth="3"/>
SfChart chart = new SfChart();
chart.AreaBackgroundColor = Color.Cyan;
chart.AreaBorderColor = Color.Gray;
chart.AreaBorderWidth = 3;NOTE
You can refer to our Xamarin Charts feature tour page for its groundbreaking feature representations. You can also explore our Xamarin.Forms Charts example to knows various chart types and how to easily configured with built-in support for creating stunning visual effects.