How can I help you?
Series
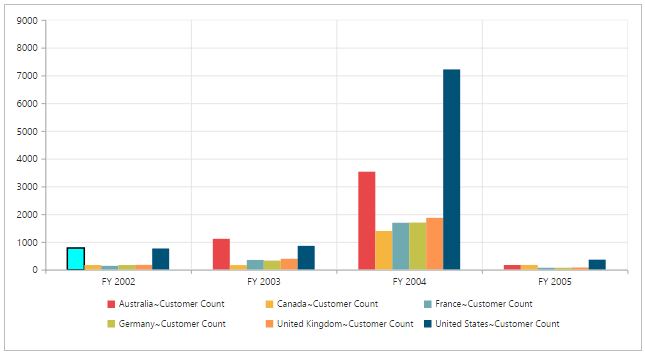
Series Point customization
By using the fill and border properties of Chart series, you can customize the PivotChart series color, border color and border width.
@Html.EJ().Pivot().PivotChart("PivotChart1").Url(Url.Content("/RelationalChartService.svc")).Size(size => size.Height("460px").Width("950px")).ClientSideEvents(
    oEve => { oEve.SeriesRendering("onSeriesRenders"); })
<script>
   function onSeriesRenders(args) {
      this.model.series[0].points[0].fill = "aqua";
      this.model.series[0].points[0].border = {
        color: "black",
         width: 2
      };
   }
</script>