- Configure pivot chart through the model properties
Contact Support
How to
11 Feb 20196 minutes to read
Configure pivot chart through the model properties
There comes a time when you want to set pivot chart properties other than using PivotChartPropertiesBuilder i.e., in the Controller side. At that time, you can pass PivotChartProperties model instance as a parameter to the pivot chart helper method.
We can set properties to pivot chart control in server-side using the PivotChartProperties class and it is used in the view page with the help of pivot chart helper overload.
In addition to the id parameter of pivot chart helper method, we can also pass PivotChartProperties model as another parameter to the pivot chart helper method.
Relational
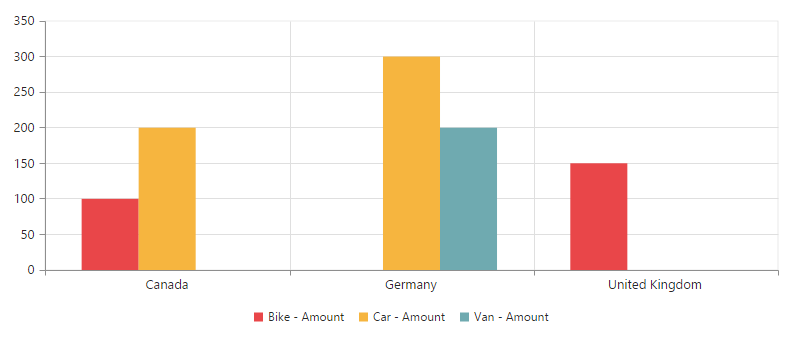
The following code example explains how to render the pivot chart control in relational mode.
@model Syncfusion.JavaScript.Models.PivotChartProperties
    @(Html.EJ().Pivot().PivotChart("PivotChart", Model))

    <script type="text/javascript">

        function load(args) {
            args.model.dataSource.data = pivot_dataset;
        }

    </script>
namespace PivotChart
{
public class PivotChartController: Controller
{
public ActionResult PivotChartFeatures()
{
Syncfusion.JavaScript.Models.PivotChartProperties pivotchart = new Syncfusion.JavaScript.Models.PivotChartProperties();
PivotDataSource pivotchartDS = new PivotDataSource();
List<Field> rows = new List<Field>();
rows.Add(new Field() { FieldName = "Country", FieldCaption = "Country" });
rows.Add(new Field() { FieldName = "State", FieldCaption = "State" });
pivotchartDS.Rows = rows;
List<Field> cols = new List<Field>();
cols.Add(new Field() { FieldName = "Product", FieldCaption = "Product" });
pivotchartDS.Columns = cols;
pivotchart.Load = "load";
List<Field> values = new List<Field>();
values.Add(new Field() { FieldName = "Amount" });
pivotchartDS.Values = values;
pivotchart.DataSource = pivotchartDS;
return View(pivotchart);
}
}
}As a result of the previous code example, the pivot chart will be displayed as shown below:
OLAP
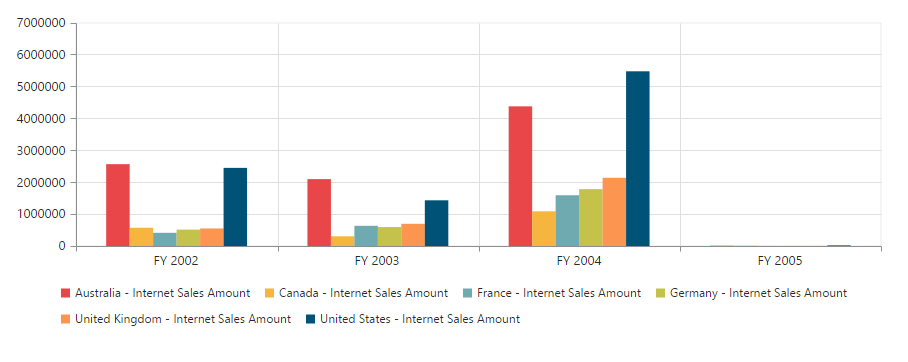
The following code example explains how to render the pivot chart control in OLAP mode.
@model Syncfusion.JavaScript.Models.PivotChartProperties
    @(Html.EJ().Pivot().PivotChart("PivotChart", Model))
namespace PivotChart
{
public class PivotChartController: Controller
{
public ActionResult PivotChartFeatures()
{
Syncfusion.JavaScript.Models.PivotChartProperties pivotchart = new Syncfusion.JavaScript.Models.PivotChartProperties();
PivotDataSource pivotchartDS = new PivotDataSource();
pivotchartDS.Data = "https://bi.syncfusion.com/olap/msmdpump.dll";
pivotchartDS.Cube = "Adventure Works";
pivotchartDS.Catalog = "Adventure Works DW 2008 SE";
List<Field> rows = new List<Field>();
rows.Add(new Field() { FieldName = "[Date].[Fiscal]" });
pivotchartDS.Rows = rows;
List<Field> cols = new List<Field>();
cols.Add(new Field() { FieldName = "[Customer].[Customer Geography]" });
pivotchartDS.Rows = cols;
List<MeasuresItems> measures = new List<MeasuresItems>();
measures.Add(new MeasuresItems() { FieldName = "[Measures].[Internet Sales Amount]" });
List<Field> values = new List<Field>();
values.Add(new Field() { Measures = measures, Axis = Syncfusion.JavaScript.AxisName.Column });
pivotchartDS.Values = values;
pivotchart.DataSource = pivotchartDS;
return View(pivotchart);
}
}
}As a result of the previous code example, the pivot chart will be displayed as shown below: