How can I help you?
3D Visualization in ASP.NET MVC PivotChart Control
The PivotChart control allows you to view the data in a 3D view. Following are the chart types that are supported:
- Bar
- Column
- Stacking Bar
- Stocking Column
- Pie
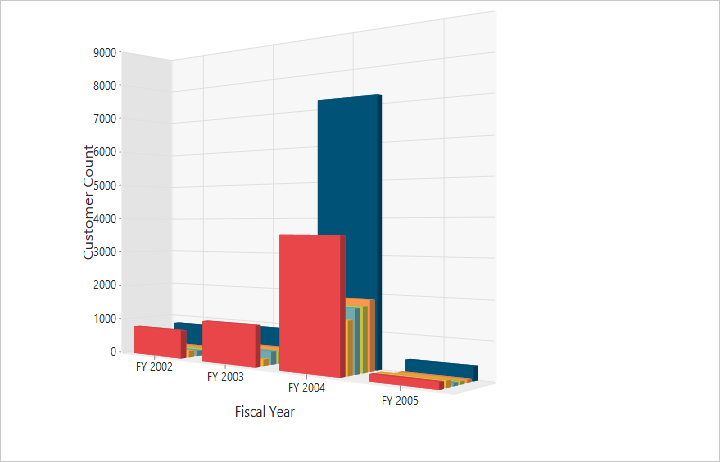
3D Column Chart
3D Column Chart is rendered by specifying the chart type as “Column” in the “CommonSeriesOptions” enumeration property as well as by setting the Enable3D property to “true”.
@Html.EJ().Pivot().PivotChart("PivotChart1").Url(Url.Content("/RelationalChartService.svc")).Rotation(24).CommonSeriesOptions(comm => { comm.Type(SeriesType.Column); }).Size(size => size.Height("450px").Width("100%")).Enable3D(true)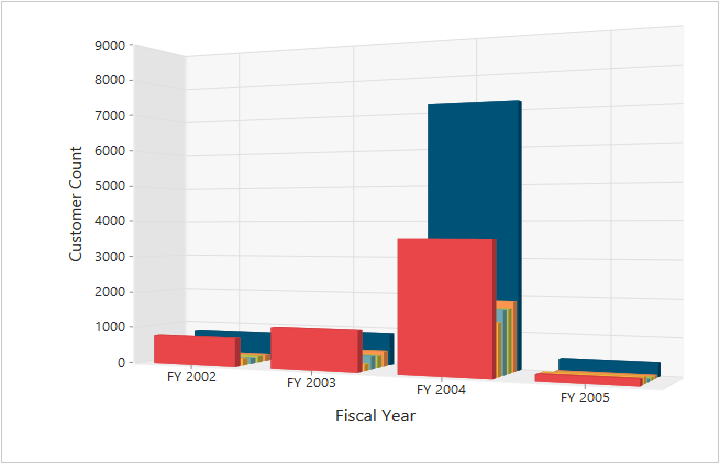
3D Bar Chart
3D Bar Chart is rendered by specifying the chart type as “Bar” in the “CommonSeriesOptions” enumeration property as well as by setting the Enable3D property to “true”.
@Html.EJ().Pivot().PivotChart("PivotChart1").Url(Url.Content("/RelationalChartService.svc")).Rotation(24).CommonSeriesOptions(comm => { comm.Type(SeriesType.Bar); }).Size(size => size.Height("450px").Width("100%")).Enable3D(true)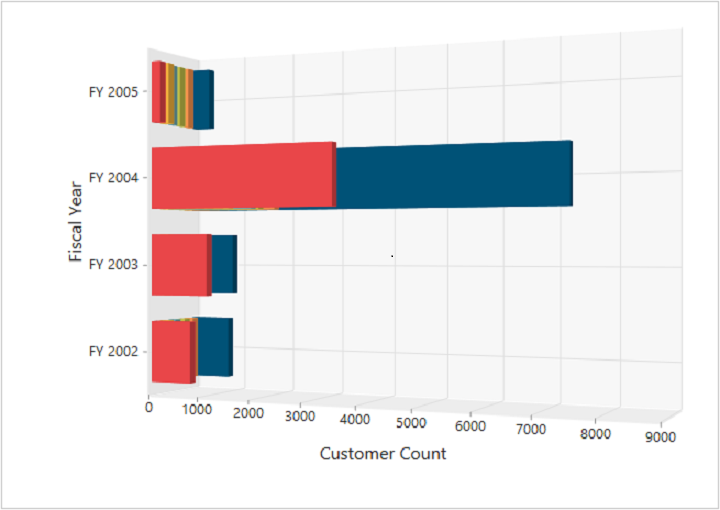
3D Stacking Bar Chart
3D Stacking Bar Chart is rendered by specifying the chart type as “Stacking Bar” in the “CommonSeriesOptions” enumeration property as well as by setting the Enable3D property to “true”.
@Html.EJ().Pivot().PivotChart("PivotChart1").Url(Url.Content("/RelationalChartService.svc")).Rotation(24).CommonSeriesOptions(comm => { comm.Type(SeriesType.StackingBar); }).Size(size => size.Height("450px").Width("100%")).Enable3D(true)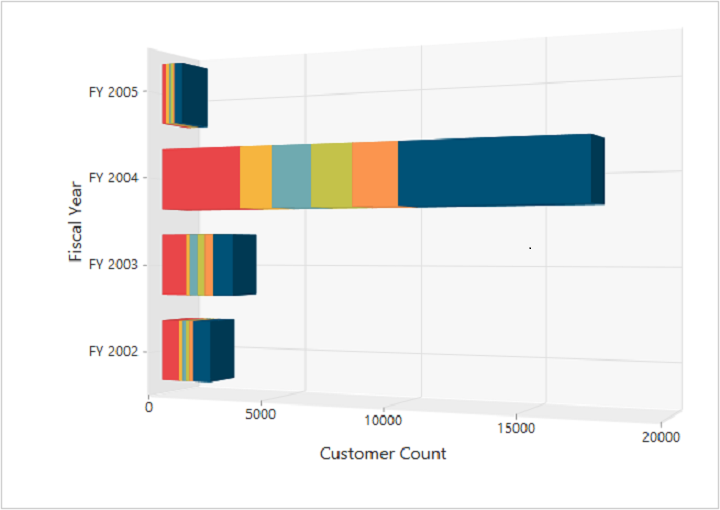
3D Stacking Column Chart
3D Stacking Column Chart is rendered by specifying the chart type as “Stacking Column” in the “CommonSeriesOptions” enumeration property as well as by setting the Enable3D property to “true”.
@Html.EJ().Pivot().PivotChart("PivotChart1").Url(Url.Content("/RelationalChartService.svc")).Rotation(24).CommonSeriesOptions(comm => { comm.Type(SeriesType.StackingColumn); }).Size(size => size.Height("450px").Width("100%")).Enable3D(true)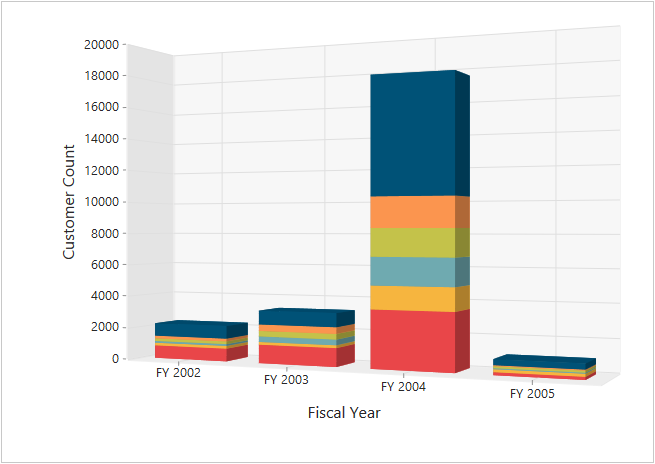
3D Pie Chart
3D Pie Chart is rendered by specifying the chart type as “Pie” in the “CommonSeriesOptions” enumeration property as well as by setting the Enable3D property to “true”.
@Html.EJ().Pivot().PivotChart("PivotChart1").Url(Url.Content("/RelationalChartService.svc")).Rotation(24).CommonSeriesOptions(comm => { comm.Type(SeriesType.Pie); }).Size(size => size.Height("450px").Width("100%")).Enable3D(true)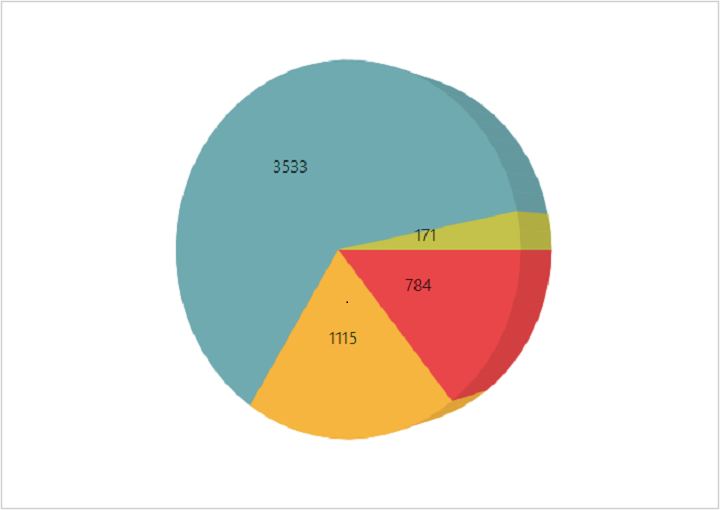
Rotating 3D Chart
We can rotate the 3D Chart towards left or right by setting an appropriate angle value to the Rotation property. The direction of the Chart display depends upon the positive or negative angle value.
@Html.EJ().Pivot().PivotChart("PivotChart1").Url(Url.Content("/RelationalChartService.svc")).Rotation(40).CommonSeriesOptions(comm => { comm.Type(SeriesType.Column); }).Size(size => size.Height("450px").Width("100%")).Enable3D(true)