How can I help you?
Axes
Label Format
Format Numeric labels
By using the LabelFormat property, you can format the numeric labels. Numeric values can be formatted with n (number with decimal points), c (currency) and p (percentage) commands.
//Applying currency format to axis labels
@Html.EJ().Pivot().PivotChart("PivotChart1").PrimaryYAxis(primaryY => primaryY.LabelFormat("c")).Url(Url.Content("/RelationalChartService.svc")).Size(size => size.Height("460px").Width("950px"))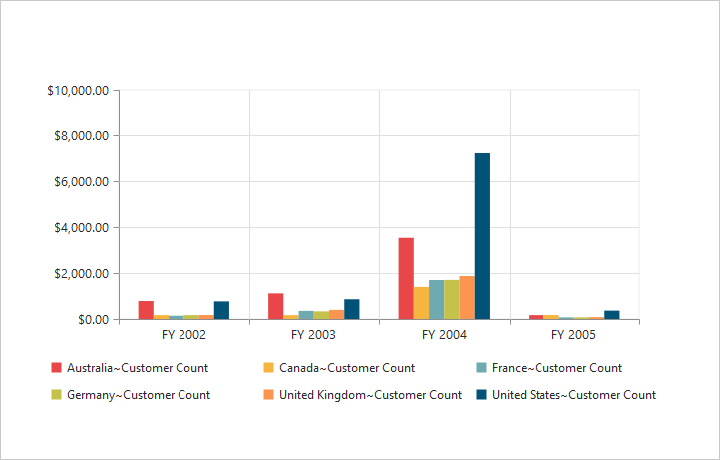
Following table describes the result on applying some commonly used label formats on numeric values.
| Label Value | Label Format Property Value | Result | Description |
|---|---|---|---|
| 1000 | n1 | 1000.0 | The Number is rounded to 1 decimal place |
| 1000 | n2 | 1000.00 | The Number is rounded to 2 decimal place |
| 1000 | n3 | 1000.000 | The Number is rounded to 3 decimal place |
| 0.01 | p1 | 1.0% | The Number is converted to percentage with 1 decimal place |
| 0.01 | p2 | 1.00% | The Number is converted to percentage with 2 decimal place |
| 0.01 | p3 | 1.000% | The Number is converted to percentage with 3 decimal place |
| 1000 | c1 | $1,000.0 | The Currency symbol is appended to number and number is rounded to 1 decimal place |
| 1000 | c2 | $1,000.00 | The Currency symbol is appended to number and number is rounded to 2 decimal place |
Label Format Customization
By using the LabelFormat property of PrimaryYAxis, you can add the category labels with prefix and/or suffix.
//Adding prefix and suffix to axis labels
@Html.EJ().Pivot().PivotChart("PivotChart1").PrimaryYAxis(primaryY => primaryY.LabelFormat("${value}K")).Url(Url.Content("/RelationalChartService.svc")).Size(size => size.Height("460px").Width("950px"))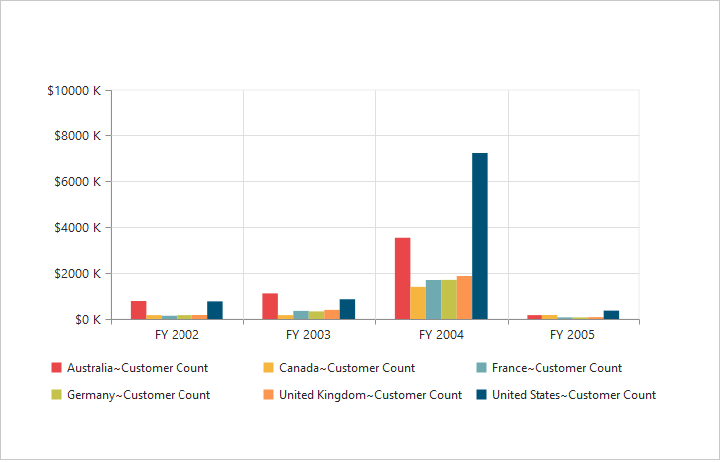
Common Axis Features
Axis Visibility
Axis visibility can be set by using the Visible property of the respective axis.
NOTE
By default, the value of
Visibleproperty is true in PivotChart.
//Disabling visibility of Y-axis
@Html.EJ().Pivot().PivotChart("PivotChart1").PrimaryYAxis(primaryY => primaryY.Visible(false)).Url(Url.Content("/RelationalChartService.svc")).Size(size => size.Height("460px").Width("950px"))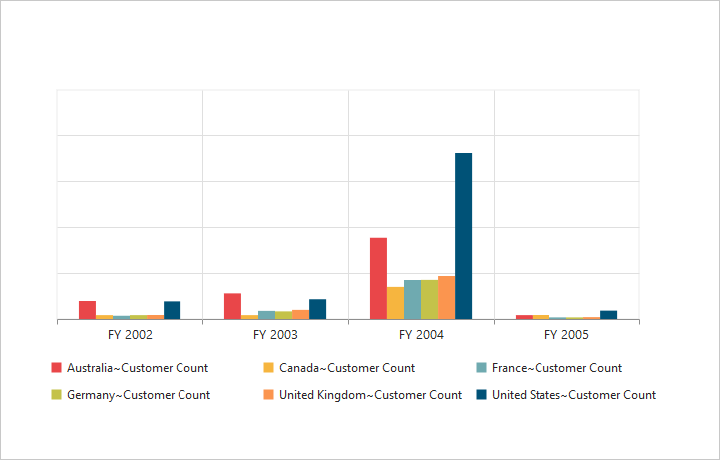
Label Customization
By using the Font property of the axis, we can customize the labels – font family, color, opacity, size and font-weight.
//Customizing label appearance
@Html.EJ().Pivot().PivotChart("PivotChart1").PrimaryXAxis(primaryX => primaryX.Font(font=> font.Size("14px").FontWeight(ChartFontWeight.Bold).FontFamily("Segoe UI").Color("blue"))).Url(Url.Content("/RelationalChartService.svc")).Size(size => size.Height("460px").Width("950px"))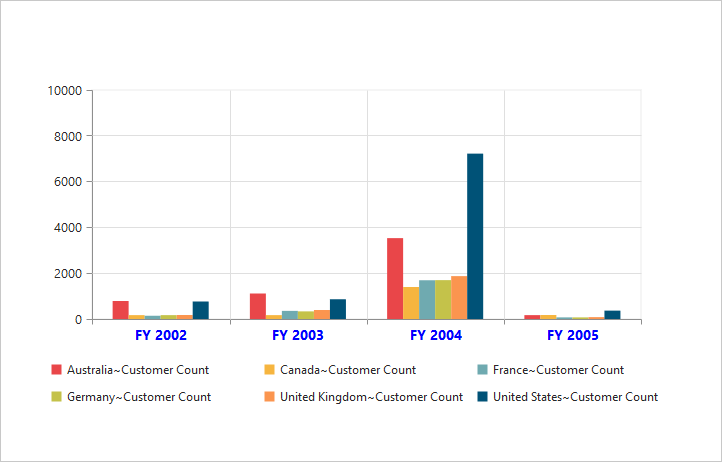
Label and Tick Positioning
Axis labels and ticks can be positioned inside or outside the Chart area by using the AxisLabelPosition and TickLinesPosition properties. The labels and ticks are positioned outside the Chart area, by default.
//Customizing label and tick positions
 @Html.EJ().Pivot().PivotChart("PivotChart1").PrimaryXAxis(primaryX => primaryX.AxisLabelPosition(AxislabelPosition.Inside).TickLinesPosition(TickLinesPosition.Inside)).Url(Url.Content("/RelationalChartService.svc")).Size(size => size.Height("460px").Width("950px"))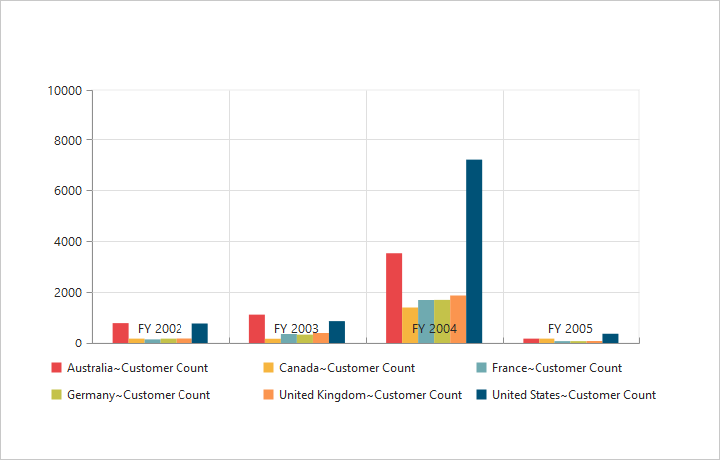
Grid Lines Customization
By using the MajorGridLines and MinorGridLines properties of the axis, you can customize the width, color, visibility and opacity of the grid lines.
NOTE
By default, the minor grid lines are not visible in PivotChart.
//Customizing grid lines
@Html.EJ().Pivot().PivotChart("PivotChart1").PrimaryXAxis(primaryX => primaryX.MajorGridLines(mr => mr.Width(5).Color("Blue").Visible(true)).MinorGridLines(mg => mg.Width(25).Color("Red").Visible(true)).MinorTicksPerInterval(1)).Url(Url.Content("/RelationalChartService.svc")).Size(size => size.Height("460px").Width("950px"))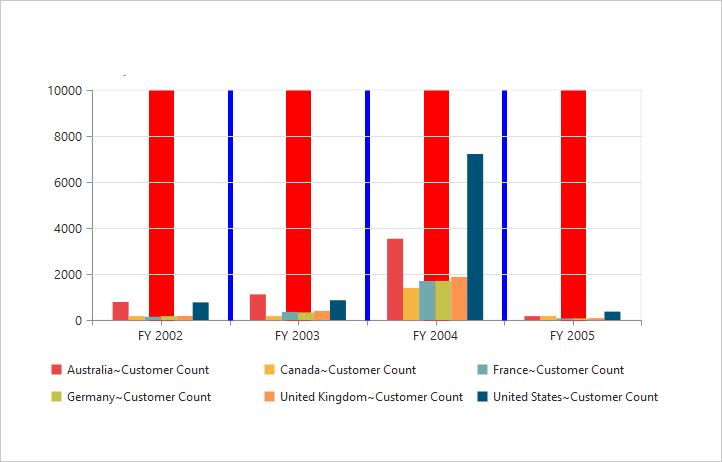
Tick Line Customization
By using the MajorTickLines and MinorTickLines properties of the axis, you can customize the width, color, visibility, size and opacity of the tick lines.
NOTE
By default, the minor tick lines are not visible in PivotChart.
//Customizing tick lines
@Html.EJ().Pivot().PivotChart("PivotChart1").PrimaryXAxis(primaryX => primaryX.MajorTickLines(mr => mr.Width(10).Size(15).Color("Blue").Size(15).Visible(true)).MinorTickLines(mg => mg.Width(15).Size(25).Color("Red").Visible(true)).MinorTicksPerInterval(1)).Url(Url.Content("/RelationalChartService.svc")).Size(size => size.Height("460px").Width("950px"))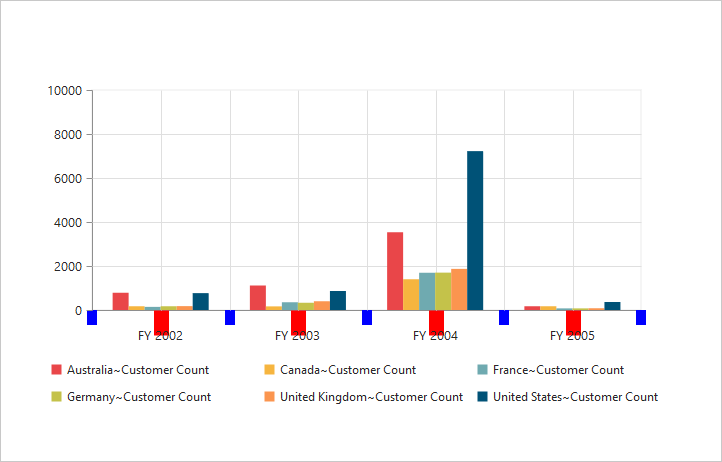
Inversing Axis
Axis can be inversed by using the IsInversed property of the axis.
NOTE
By default, the
IsInversedproperty is false in PivotChart.
//Inversing the X and Y-axis
@Html.EJ().Pivot().PivotChart("PivotChart1").PrimaryXAxis(primaryX => primaryX.IsInversed(true)).PrimaryYAxis(primaryY => primaryY.IsInversed(true)).Url(Url.Content("/RelationalChartService.svc")).Size(size => size.Height("460px").Width("950px"))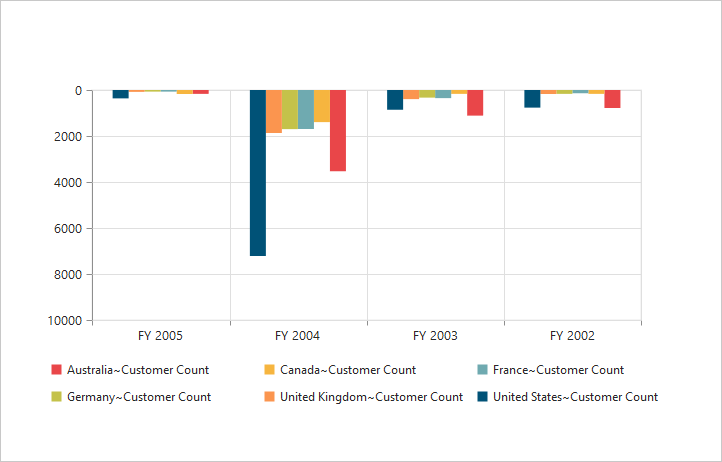
Placing Axes at Opposite Side
The OpposedPosition property of Chart axis can be used to place the axis at the opposite direction from its default position.
NOTE
By default, the
OpposedPositionproperty is false in PivotChart.
//Placing axis at the opposite side of its normal position
@Html.EJ().Pivot().PivotChart("PivotChart1").PrimaryXAxis(primaryX => primaryX.OpposedPosition(true)).PrimaryYAxis(primaryY => primaryY.OpposedPosition(true)).Url(Url.Content("/RelationalChartService.svc")).Size(size => size.Height("460px").Width("950px"))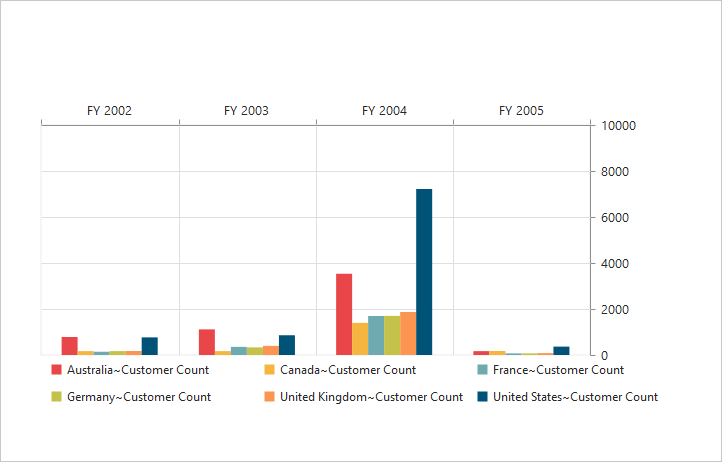
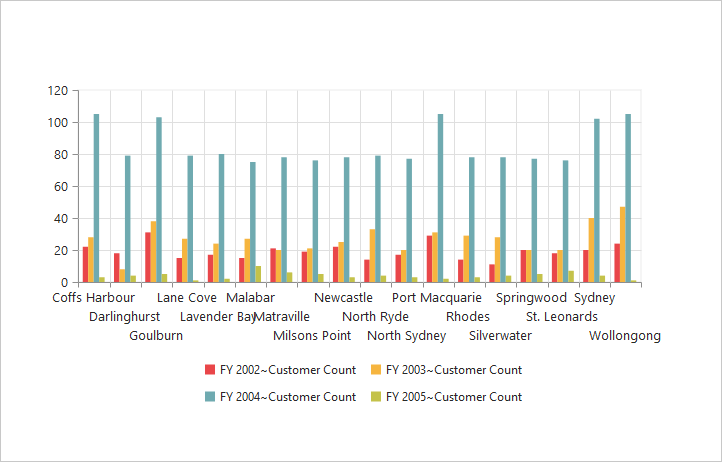
Smart Axis Labels
When the axis labels overlap with each other based on the Chart dimensions and label size, you can use LabelIntersection property of the axis to avoid overlapping.
NOTE
By default, the
LabelIntersectionproperty is none in PivotChart.
- Rotate45
- Rotate90
- Trim
- MultipleRows
- Wrap
- Hide.
// Avoid overlapping of x-axis labels
@Html.EJ().Pivot().PivotChart("PivotChart1").PrimaryXAxis(primaryX => primaryX. LabelIntersectAction(LabelIntersectAction.MultipleRows)).Url(Url.Content("/RelationalChartService.svc")).Size(size => size.Height("460px").Width("950px"))