- Horizontal Stripline
- Vertical Stripline
- Customize the Text
- Customize the Stripline
- Change the Z-order of the stripline
Contact Support
Striplines
28 Jun 20178 minutes to read
EjChart supports horizontal and vertical striplines.
Horizontal Stripline
You can create horizontal stripline by adding the e-primaryxaxis-stripline in the vertical axis and set visible option to true. Striplines are rendered in the specified start to end range and you can add more than one stripline for an axis.
<html xmlns="http://www.w3.org/1999/xhtml" lang="en" ng-app="ChartApp">
    <head>
        <title>Essential Studio for AngularJS: Chart</title>
        <!--CSS and Script file References -->
    </head>
    <body ng-controller="ChartCtrl">
        <div id="container" ej-chart>
        <e-primaryyaxis-stripline>
        <e-primaryyaxis-stripline e-visible="true" e-start="30" e-end="40">
        </e-primaryyaxis-stripline>
        </e-primaryyaxis-stripline>
        </div>
        <script>
        angular.module('ChartApp', ['ejangular'])
        .controller('ChartCtrl', function ($scope) {

                   });
        </script>
    </body>
</html>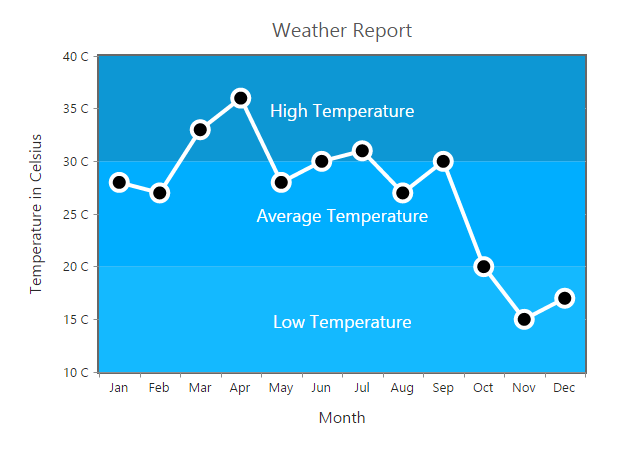
Vertical Stripline
You can create vertical stripline by adding the e-primaryyaxis-stripline in the horizontal axis and set visible option to true.
<html xmlns="http://www.w3.org/1999/xhtml" lang="en" ng-app="ChartApp">
    <head>
        <title>Essential Studio for AngularJS: Chart</title>
        <!--CSS and Script file References -->
    </head>
    <body ng-controller="ChartCtrl">
        <div id="container" ej-chart>
        <e-primaryxaxis-stripline>
        <e-primaryxaxis-stripline e-visible="true" e-start="3" e-end="7">
        </e-primaryxaxis-stripline>
        </e-primaryxaxis-stripline>
        </div>
        <script>
        angular.module('ChartApp', ['ejangular'])
        .controller('ChartCtrl', function ($scope) {
                   });
        </script>
    </body>
</html>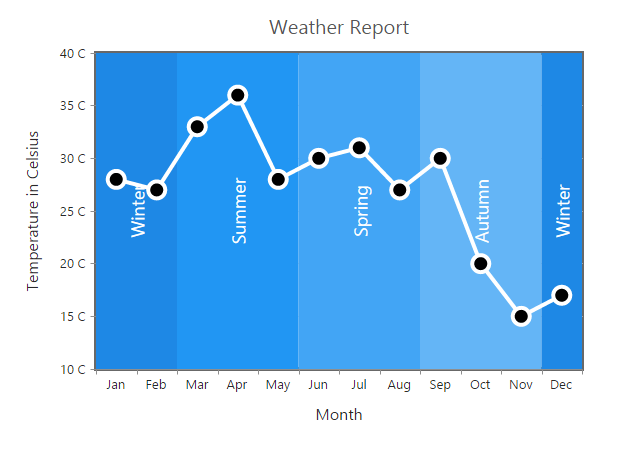
Customize the Text
To customize the stripLine text, use the text and fontoptions.
<html xmlns="http://www.w3.org/1999/xhtml" lang="en" ng-app="ChartApp">
    <head>
        <title>Essential Studio for AngularJS: Chart</title>
        <!--CSS and Script file References -->
    </head>
    <body ng-controller="ChartCtrl">
        <div id="container" ej-chart>
        <e-primaryyaxis-stripline>
        <e-primaryyaxis-stripline e-text="High Temperature" e-font-size="18px"
        e-font-color="white">
        </e-primaryyaxis-stripline>
        </e-primaryyaxis-stripline>
        </div>
        <script>
        angular.module('ChartApp', ['ejangular'])
        .controller('ChartCtrl', function ($scope) {

                   });
        </script>
    </body>
</html>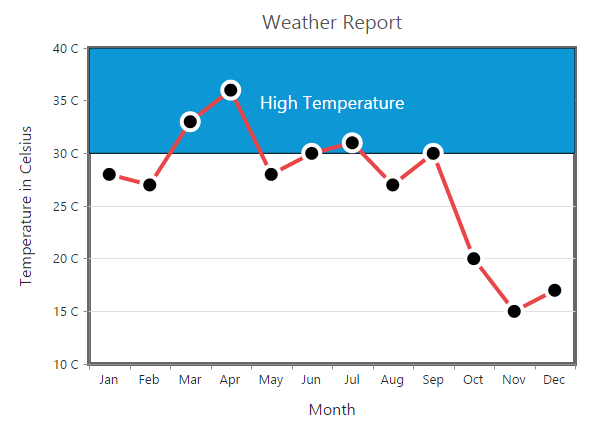
Text Alignment
Stripline text can be aligned by using the textAlignment property.
<html xmlns="http://www.w3.org/1999/xhtml" lang="en" ng-app="ChartApp">
    <head>
        <title>Essential Studio for AngularJS: Chart</title>
        <!--CSS and Script file References -->
    </head>
    <body ng-controller="ChartCtrl">
        <div id="container" ej-chart>
        <e-primaryyaxis-stripline>
        <e-primaryyaxis-stripline e-textalignment="middletop">
        </e-primaryyaxis-stripline>
        </e-primaryyaxis-stripline>
        </div>
        <script>
        angular.module('ChartApp', ['ejangular'])
        .controller('ChartCtrl', function ($scope) {
                   });
        </script>
    </body>
</html>
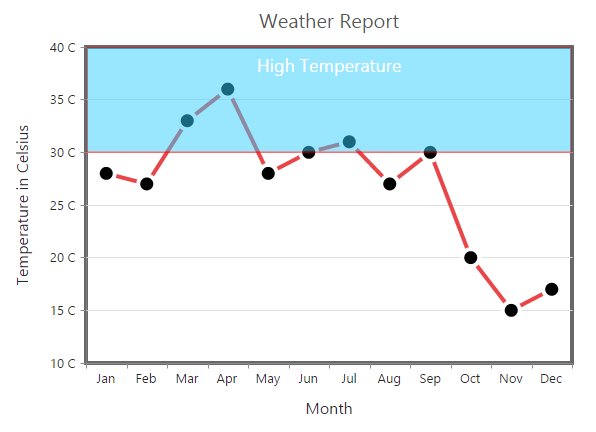
Customize the Stripline
To customize the stripLine styles, use the color, opacity, borderWidthand borderColor properties.
<html xmlns="http://www.w3.org/1999/xhtml" lang="en" ng-app="ChartApp">
    <head>
        <title>Essential Studio for AngularJS: Chart</title>
        <!--CSS and Script file References -->
    </head>
    <body ng-controller="ChartCtrl">
        <div id="container" ej-chart>
        <e-primaryyaxis-stripline>
        <e-primaryyaxis-stripline e-color="#33CCFF" e-borderwidth="2" e-opacity="0.5"
        e-bordercolor="red">
        </e-primaryyaxis-stripline>
        </e-primaryyaxis-stripline>
        </div>
        <script>
        angular.module('ChartApp', ['ejangular'])
        .controller('ChartCtrl', function ($scope) {
                  });
        </script>
    </body>
</html>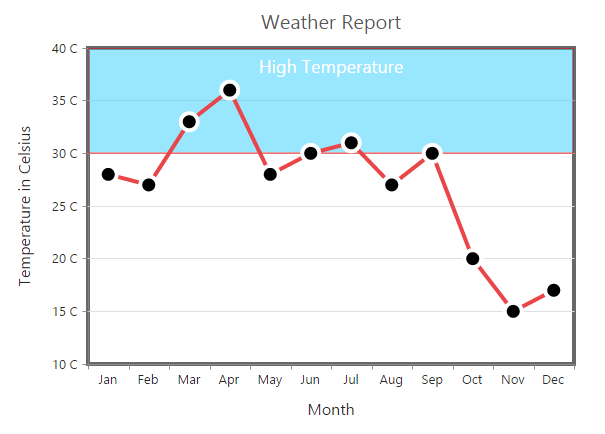
Change the Z-order of the stripline
Stripline zIndex] property is used to display the stripLine either behind or over the series.
<html xmlns="http://www.w3.org/1999/xhtml" lang="en" ng-app="ChartApp">
    <head>
        <title>Essential Studio for AngularJS: Chart</title>
        <!--CSS and Script file References -->
    </head>
    <body ng-controller="ChartCtrl">
        <div id="container" ej-chart>
        <e-primaryyaxis-stripline>
        <e-primaryyaxis-stripline e-zindex="over">
        </e-primaryyaxis-stripline>
        </e-primaryyaxis-stripline>
        </div>
        <script>
        angular.module('ChartApp', ['ejangular'])
        .controller('ChartCtrl', function ($scope) {
                });
        </script>
    </body>
</html>