Chart Series
28 Jun 201711 minutes to read
Multiple Series
In EjChart, you can add multiple series object in the e-series options. The series are rendered in the order it is added to the e-series option, by default. You can change this order by using the e-series-zOrder option.
<html xmlns="http://www.w3.org/1999/xhtml" lang="en" ng-app="ChartApp">
    <head>
        <title>Essential Studio for AngularJS: Chart</title>
        <!--CSS and Script file References -->
    </head>
    <body ng-controller="ChartCtrl">
         <div id="container" ej-chart>
         <e-series>
         <e-series e-name="Gold" e-datasource=dataSource e-xname="XValue" e-yname="YValue1" >
         </e-series>
         <e-series e-name="Silver" e-datasource=dataSource e-xname="XValue" e-yname="YValue2" >
         </e-series>
         <e-series e-name="Bronze" e-datasource=dataSource e-xname="XValue" e-yname="YValue3">
         </e-series>
         </e-series>
         </div>
         <script>
         var chartData= [
              { "XValue": "USA", "YValue1": 50, "YValue2": 70, "YValue3": 45 },
              { "XValue": "China", "YValue1": 40, "YValue2": 60, "YValue3": 55 },
              { "XValue": "Japan", "YValue1": 70, "YValue2": 60, "YValue3": 50 },
              { "XValue": "Australia", "YValue1": 60, "YValue2": 56, "YValue3": 40 },
              { "XValue": "France", "YValue1": 50, "YValue2": 45, "YValue3": 35 },
              { "XValue": "Germany", "YValue1": 40, "YValue2": 30, "YValue3": 22 },
              { "XValue": "Italy", "YValue1": 40, "YValue2": 35, "YValue3": 37 },
              { "XValue": "Sweden", "YValue1": 30, "YValue2": 35, "YValue3": 27 }];
         angular.module('ChartApp', ['ejangular'])
         .controller('ChartCtrl', function ($scope) {
                $scope.dataSource="chartData";
                });
         </script>
    </body>
</html>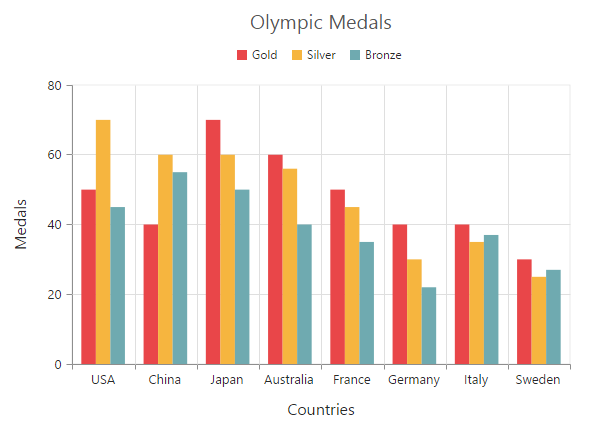
Customizing all series together
By using the e-commonSeriesOptions, you can customize the series options for all the series commonly, instead of setting the options directly on each series object.
NOTE
The inline properties of the series has the first priority and override the commonSeriesOptions.
The following code example explains on how to enable marker, tooltip and animation for the chart series by using the commonSeriesOptions.
<html xmlns="http://www.w3.org/1999/xhtml" lang="en" ng-app="ChartApp">
    <head>
        <title>Essential Studio for AngularJS: Chart</title>
        <!--CSS and Script file References -->
    </head>
    <body ng-controller="ChartCtrl">
        <div id="container" ej-chart e-commonseriesoptions-type="line"
        e-commonseriesoptions-enableanimation="true"
        e-commonseriesoptions-tooltip-visible="true" e-commonseriesoptions-tooltip-template="template"
        e-commonseriesoptions-marker-visible="true" e-commonseriesoptions-marker-shape="circle"
        e-commonseriesoptions-marker-size-height="10" e-commonseriesoptions-marker-size-width=10
        e-commonseriesoptions-marker-border-width="2">
         <e-series>
         <e-series e-name="Gold" e-datasource=dataSource e-xname="XValue" e-yname="YValue1" >
         </e-series>
         <e-series e-name="Silver" e-datasource=dataSource e-xname="XValue" e-yname="YValue2" >
         </e-series>
         <e-series e-name="Bronze" e-datasource=dataSource e-xname="XValue" e-yname="YValue3">
         </e-series>
         </e-series>
        </div>
        <script>
               angular.module('ChartApp', ['ejangular'])
                .controller('ChartCtrl', function ($scope) {

                    });
        </script>
    </body>
</html>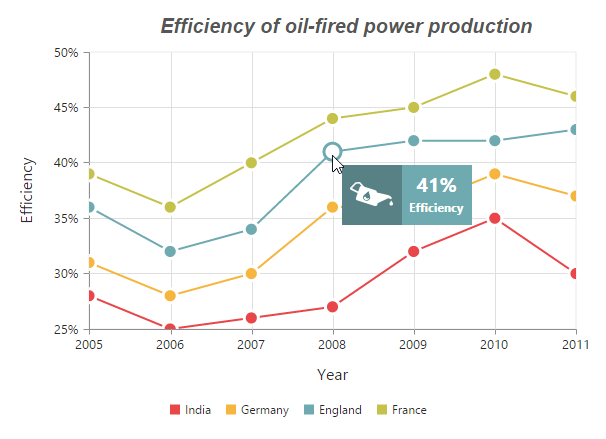
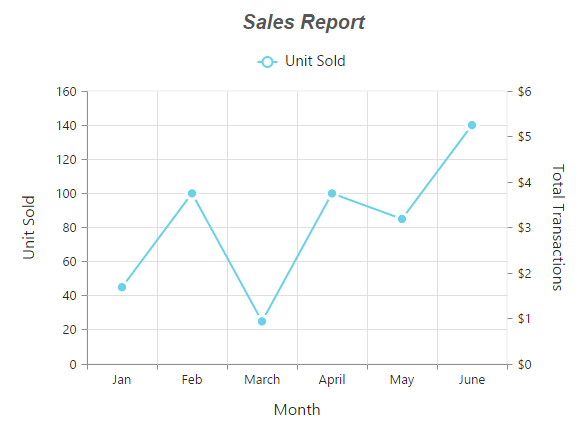
Combination Series
EjChart allows you to render the combination of different series in the chart.
<html xmlns="http://www.w3.org/1999/xhtml" lang="en" ng-app="ChartApp">
    <head>
        <title>Essential Studio for AngularJS: Chart</title>
        <!--CSS and Script file References -->
    </head>
    <body ng-controller="ChartCtrl">
         <div id="container" ej-chart>
         <e-series>
          //Set chart type to series1
         <e-series e-type="column" >
         </e-series>
          //Set chart type to series2
         <e-series e-type="line" >
         </e-series>
         </e-series>
         </div>
         <script>
         angular.module('ChartApp', ['ejangular'])
         .controller('ChartCtrl', function ($scope) {
                  });
         </script>
    </body>
</html>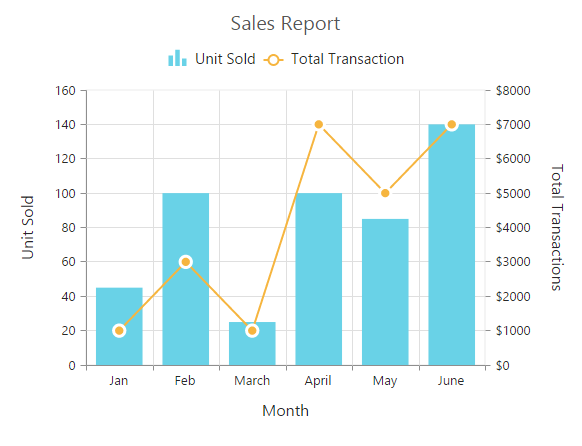
Limitation of combination chart
-
Bar,StackingBar, andStackingBar100cannot be combined with the other Cartesian type series. -
Cartesian type series cannot be combined with the accumulation series (
pie,doughnut,funnel, andpyramid). -
PolarandRadarseries cannot be combined with the accumulation and Cartesian type series.
When the combination of Cartesian and accumulation series types are added to the series option, the series that are similar to the first series are rendered and other series are ignored. The following code example illustrates this,
<html xmlns="http://www.w3.org/1999/xhtml" lang="en" ng-app="ChartApp">
    <head>
        <title>Essential Studio for AngularJS: Chart</title>
        <!--CSS and Script file References -->
    </head>
    <body ng-controller="ChartCtrl">
         <div id="container" ej-chart>
         <e-series>
         <e-series e-type="line" e-name="Gold" e-datasource=dataSource e-xname="XValue"
         e-yname="YValue1"></e-series>
         <e-series e-type="pie" e-name="Silver" e-datasource=dataSource e-xname="XValue"
         e-yname="YValue2" ></e-series>
         </e-series>
         </div>
         <script>
         var chartData= [
              { "XValue": "USA", "YValue1": 50, "YValue2": 70 },
              { "XValue": "China", "YValue1": 40, "YValue2": 60},
              { "XValue": "Japan", "YValue1": 70, "YValue2": 60},
              { "XValue": "Australia", "YValue1": 60, "YValue2": 56 },
              { "XValue": "France", "YValue1": 50, "YValue2": 45 },
              { "XValue": "Germany", "YValue1": 40, "YValue2": 30 },
              { "XValue": "Italy", "YValue1": 40, "YValue2": 35},
              { "XValue": "Sweden", "YValue1": 30, "YValue2": 35 }];
         angular.module('ChartApp', ['ejangular'])
         .controller('ChartCtrl', function ($scope) {
                $scope.dataSource="chartData";
                });
         </script>
    </body>
</html>