How can I help you?
Getting Started
Before we start with the Chart, please refer this page for general information regarding integrating Syncfusion widget’s.
Adding script reference
To render the Chart control, the following list of external dependencies are needed,
The required angular script as angular.min.js and ej.widget.angular.min.js which can be available in below CDN links:
-
angular.min.js- http://cdn.syncfusion.com/js/assets/external/angular.min.js -
ej.widget.angular.min.js- http://cdn.syncfusion.com/32.2.3/js/common/ej.widget.angular.min.js
The other required internal dependencies are tabulated below,
| Files | Description/Usage |
|---|---|
| ej.core.min.js | It is referred always before using all the JS controls. |
| ej.data.min.js | Used to handle data operation and is used while binding data to the JS controls. |
| ej.globalize.min.js | It is referred when using localization in Chart. |
| ej.chart.min.js | Chart core script file which includes chart related scripts files. |
| ej.scroller.min.js | It is referred when scrolling is used in the Chart. |
NOTE
Refer the
ej.web.all.min.js(which encapsulates all theejcontrols and frameworks in a single file) in the application instead of referring all the above specified internal dependencies.
To get the real appearance of the Chart, the dependent CSS file ej.web.all.min.css (which includes styles of all the widgets) should also needs to be referred.
So the complete boilerplate code is
<!DOCTYPE html>
    <html xmlns="http://www.w3.org/1999/xhtml" lang="en" ng-app="syncApp">
    <head>
    <title>Essential Studio for AngularJS: Chart</title>
    <!-- Essential Studio for JavaScript  theme reference -->
    <link href="http://cdn.syncfusion.com/32.2.3/js/web/flat-azure/ej.web.all.min.css" rel="stylesheet" />
    <!-- Essential Studio for JavaScript  script references -->
    <script src="http://cdn.syncfusion.com/js/assets/external/jquery-3.0.0.min.js"></script>
    <script src="http://cdn.syncfusion.com/js/assets/external/jsrender.min.js"></script>
    <script src="http://cdn.syncfusion.com/js/assets/external/angular.min.js"></script>
    <script src="http://cdn.syncfusion.com/32.2.3/js/web/ej.web.all.min.js"></script>
    <script src="http://cdn.syncfusion.com/32.2.3/js/common/ej.widget.angular.min.js" type="text/javascript"></script>
    <!-- Add your custom scripts here -->
    </head>
    <body>
    </body>
    </html>
NOTE
- In production, we highly recommend you to use our
custom script generatorto create custom script file with required controls and its dependencies only. Also to reduce the file size further please useGZip compressionin your server.- For themes, you can use the
ej.web.all.min.cssCDN link from the code snippet given. To add the themes in your application, please refer tothis link.- If you are using the Essential Studio below 13.4.0.53 version, then you need to refer jQuery.globalize.js script file along with the above references to render the Chart control.
Create Chart
All the Essential JavaScript directives have been encapsulated into a single module called ejangular so the first step would be to declare dependency for this module within your AngularJS application.
The chart can be created using ej-chart AngularJS directive and its properties can be defined using e- prefix followed by the property name.(For example, e-size)
The code example for defining controls in AngularJS is as follows,
<html xmlns="http://www.w3.org/1999/xhtml" lang="en" ng-app="ChartApp">
    <head>
        <title>Essential Studio for AngularJS: Chart</title>
        <!--CSS and Script file References -->
    </head>
    <body ng-controller="ChartCtrl">
        <div id="container" ej-chart e-size-height="500px" e-size-width="800px">
        </div>
        <script>
                angular.module('ChartApp', ['ejangular'])
                .controller('ChartCtrl', function ($scope) {
                 });
        </script>
    </body>
</html>
Data Binding
Typically, you will assign data directly to chart using dataSource property of the series. In AngularJS, you need to bind the variable, which contains data in the AngularJS scope object, to the dataSource property as illustrated in the following code example,
IMPORTANT
Essential JS includes AngularJS directives for all controls in the ej.widget.angular.min.js script file.
NOTE
All the properties in EjChart supports one way AngularJS binding except inner array properties like series.points[], series.trendlines[]. Click here to know more about Essential AngularJS and the properties which support two way AngularJS binding in chart.
<html xmlns="http://www.w3.org/1999/xhtml" lang="en" ng-app="ChartApp">
    <head>
        <title>Essential Studio for AngularJS: Chart</title>
        <!--CSS and Script file References -->
    </head>
    <body ng-controller="ChartCtrl">
        <div id="container" ej-chart>
         <e-series>
            <e-series e-datasource=dataSource e-xname="month" e-yname="sales">
            </e-series>
        </e-series>
    </div>
    </body>
</html><script>
var chartData = [ { month: 'Jan', sales: 35 },
{ month: 'Feb', sales: 28 },
{ month: 'Mar', sales: 34 },
{ month: 'Apr', sales: 32 },
{ month: 'May', sales: 40 },
{ month: 'Jun', sales: 32 },
{ month: 'Jul', sales: 35 },
{ month: 'Aug', sales: 55 },
{ month: 'Sep', sales: 38 },
{ month: 'Oct', sales: 30 },
{ month: 'Nov', sales: 25 },
{ month: 'Dec', sales: 32 }
];
angular.module('ChartApp', ['ejangular'])
.controller('ChartCtrl', function ($scope) {
$scope.dataSource = chartData;
});
</script>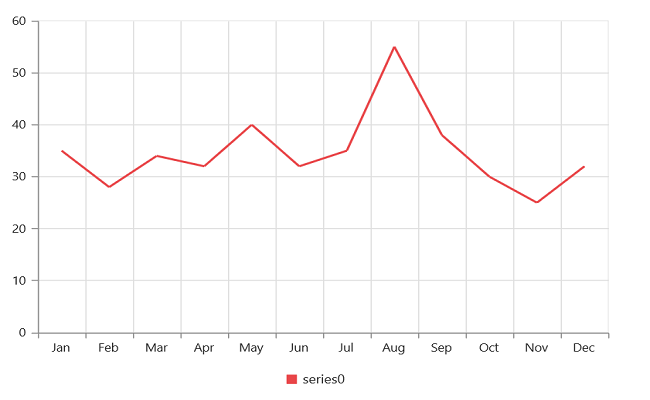
Need to edit the JS playground sample
Click here to view the AngularJS data binding online demo sample.
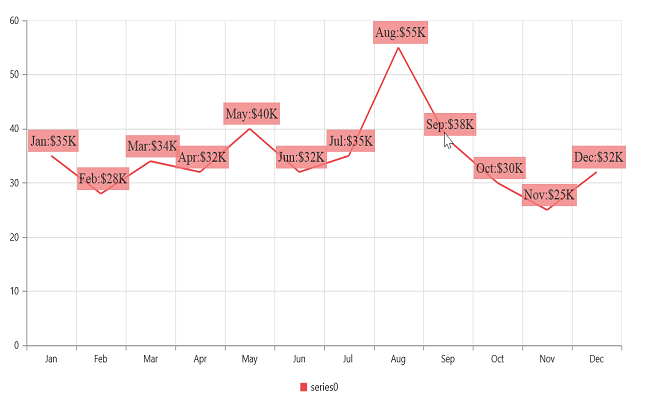
Add Data Labels
You can add data labels to improve the readability of the chart. This can be achieved by enabling the e-visible option in the e-marker-dataLabel option. Now, the data labels are rendered at the top of all the data points.
The following code example illustrates this,
<div id="container" ej-chart>
        <e-series>
            <e-series  e-marker-visible="true"
            e-marker-datalabel-visible="true">
            </e-series>
        </e-series>
    </div>
    <script>
        angular.module('ChartApp', ['ejangular'])
        .controller('ChartCtrl', function ($scope) {
               });
    </script>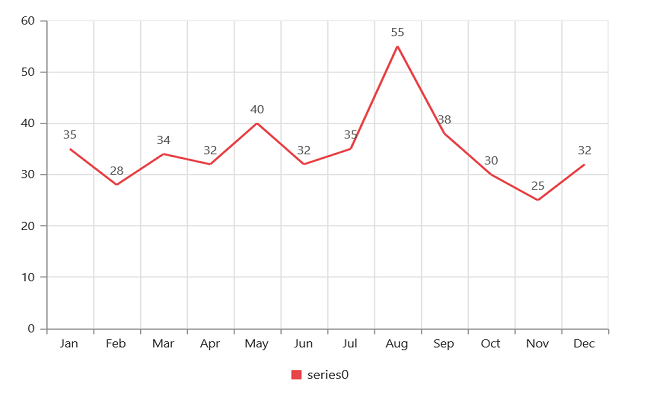
There are situations where the default label content is not sufficient to the user. In this case, you can use the template option to format the label content with some additional information.
<!DOCTYPE html>
<html>
<body>
  <div id="dataLabelTemplate" style="display:none; padding:3px;background-color:#F08080; opacity:0.8;">
  <div id="point">#point.x#:$#point.y#K</div>
   </div>
</body>
</html>
The above HTML template is used as a template for each data label. Here, “point.x” and “point.y” are the placeholder text used to display the corresponding data point’s x & y value.
The following code example shows how to set the id of the above template to template option,
angular.module('ChartApp', ['ejangular'])
     .controller('ChartCtrl', function ($scope) {
                $scope.dataSource = chartData;
                $scope.markerOptions = {
                    dataLabel: {
                        visible: true,
                        template: "dataLabelTemplate"
                    }
                };
            });
Enable Legend
You can enable or disable the legend by using the visible option in the legend. It is enabled in the chart, by default.
<div id="container" e-legend-visible="true">
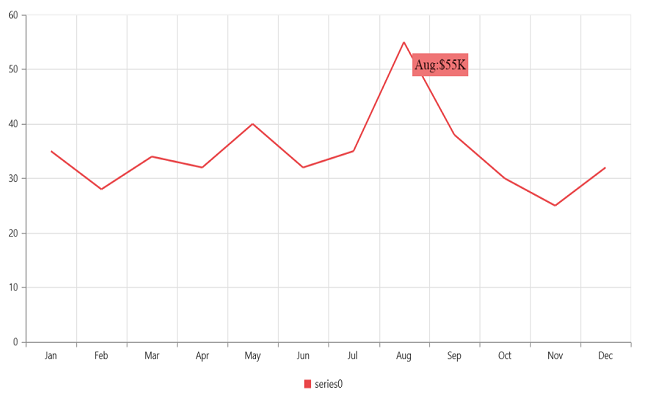
</div>Enable Tooltip
The Tooltip is useful when you cannot display information by using the Data Labels due to the space constraints. You can enable tooltip by using the visibleoption of the tooltip in the specific series.
The following code example illustrates this,
<div id="Template" style="display:none; padding:3px;background-color:red; opacity:0.6;">
    <div id="point">#point.x#:$#point.y#K</div>
    </div>
    <div id="container" ej-chart>
        <e-series>
            <e-series e-tooltip-visible="true" e-tooltip-template="Template" >
            </e-series>
        </e-series>
    </div>
    <script>
            angular.module('ChartApp', ['ejangular'])
            .controller('ChartCtrl', function ($scope) {
               //...
               });
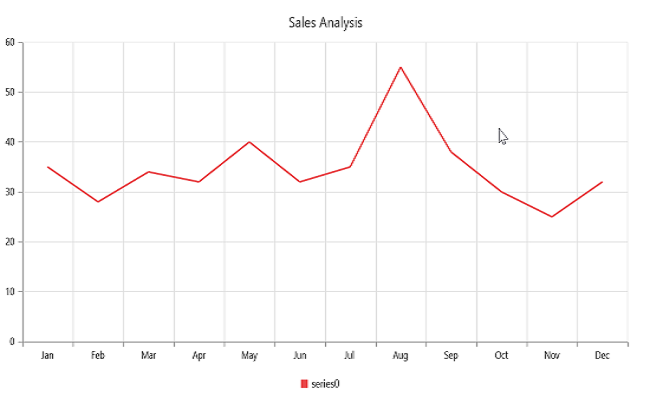
Add Chart Title
You need to add a title to the chart to provide quick information to the user about the data being plotted in the chart. You can add it by using the text
option of the title.
<div id="container" ej-chart e-title-text="Sales Analysis">
    </div>
 <script>
            angular.module('ChartApp', ['ejangular'])
            .controller('ChartCtrl', function ($scope) {
              });
 </script>