How can I help you?
Legend
The legend contains the list of chart series and Trendlines that appear in a chart.
Legend Visibility
By default, the legend is enabled in the chart. You can enable or disable it by using the e-legend-visible option .
<html xmlns="http://www.w3.org/1999/xhtml" lang="en" ng-app="ChartApp">
    <head>
        <title>Essential Studio for AngularJS: Chart</title>
        <!--CSS and Script file References -->
    </head>
    <body ng-controller="ChartCtrl">
        <div id="container" ej-chart e-legend-visible="true">
        </div>
        <script>
        angular.module('ChartApp', ['ejangular'])
        .controller('ChartCtrl', function ($scope) {
                     });
        </script>
    </body>
</html>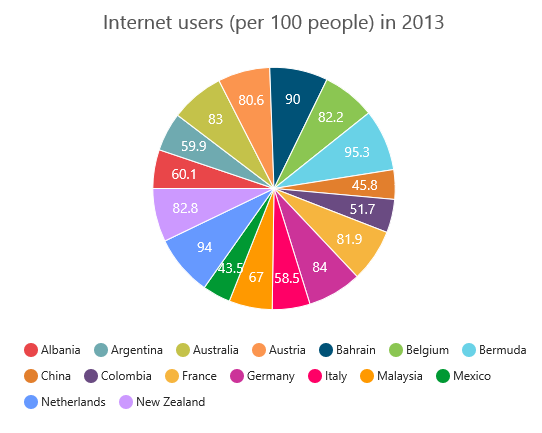
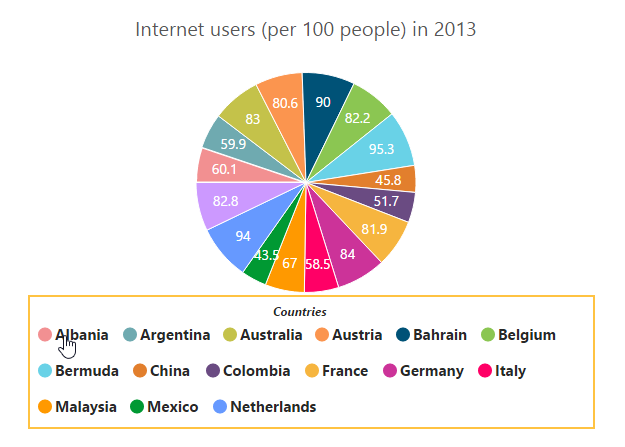
Legend title
To add the title to the legend, you have to specify the e-legend-title-text option.
<html xmlns="http://www.w3.org/1999/xhtml" lang="en" ng-app="ChartApp">
    <head>
        <title>Essential Studio for AngularJS: Chart</title>
        <!--CSS and Script file References -->
    </head>
    <body ng-controller="ChartCtrl">
        <div id="container" ej-chart e-legend-title-text="Countries">
        </div>
        <script>
        angular.module('ChartApp', ['ejangular'])
        .controller('ChartCtrl', function ($scope) {
                     });
        </script>
    </body>
</html>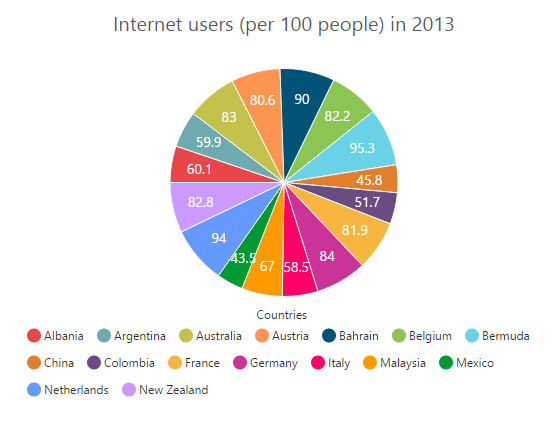
Position and Align the Legend
By using the e-legend-positionoption, you can position the legend at left, right, top or bottom of the chart. The legend is positioned at the bottom of the chart, by default.
<html xmlns="http://www.w3.org/1999/xhtml" lang="en" ng-app="ChartApp">
    <head>
        <title>Essential Studio for AngularJS: Chart</title>
        <!--CSS and Script file References -->
    </head>
    <body ng-controller="ChartCtrl">
        <div id="container" ej-chart e-legend-position="top">
        </div>
        <script>
        angular.module('ChartApp', ['ejangular'])
        .controller('ChartCtrl', function ($scope) {
                     });
        </script>
    </body>
</html>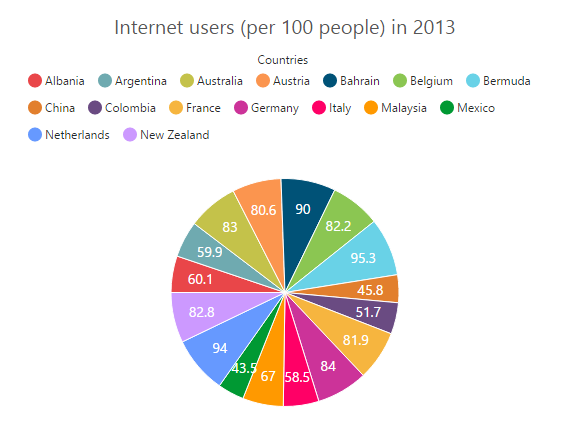
Legend Alignment
You can align the legend to the center, far or near based on its position by using the e-legend-alignment option.
<html xmlns="http://www.w3.org/1999/xhtml" lang="en" ng-app="ChartApp">
    <head>
        <title>Essential Studio for AngularJS: Chart</title>
        <!--CSS and Script file References -->
    </head>
    <body ng-controller="ChartCtrl">
        <div id="container" ej-chart e-legend-position="top" e-legend-alignment="far">
        </div>
        <script>
        angular.module('ChartApp', ['ejangular'])
        .controller('ChartCtrl', function ($scope) {
                     });
        </script>
    </body>
</html>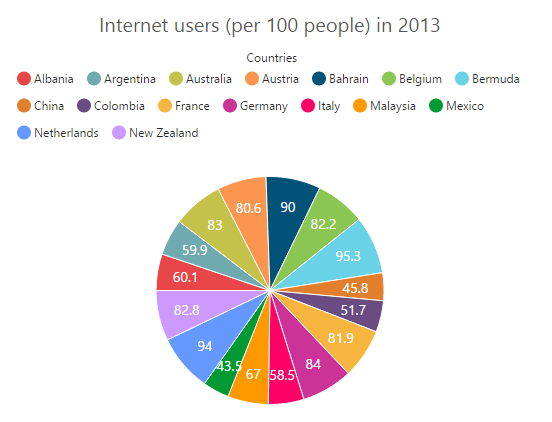
Arrange legend items in the rows and columns
You can arrange the legend items horizontally and vertically by using the e-legend-rowCount and e-legend-columnCount options of the legend.
-
When only the
e-legend-rowCountis specified, the legend items are arranged according to thee-legend-rowCountand number of columns may vary based on the number of legend items. -
When only the
e-legend-columnCountis specified, the legend items are arranged according to thee-legend-columnCountand number of rows may vary based on the number of legend items. -
When both the options are specified, then the one which has higher value is given preference. For example, when the
e-legend-rowCountis 4 ande-legend-columnCountis 3, legend items are arranged in 4 rows. -
When both the options are specified and have the same value, the preference is given to the
e-legend-columnCountwhen it is positioned at the top/bottom position. The preference is given to thee-legend-rowCountwhen it is positioned at the left/right position.
<html xmlns="http://www.w3.org/1999/xhtml" lang="en" ng-app="ChartApp">
    <head>
        <title>Essential Studio for AngularJS: Chart</title>
        <!--CSS and Script file References -->
    </head>
    <body ng-controller="ChartCtrl">
        <div id="container" ej-chart e-legend-rowcount="4" e-legend-columncount="4">
        </div>
        <script>
        angular.module('ChartApp', ['ejangular'])
        .controller('ChartCtrl', function ($scope) {
                     });
        </script>
    </body>
</html>
Customization
Legend shape
To change the legend icon shape, you have to specify the shape in the e-legend-shape property of the legend. When you want the legend icon to display the prototype of the series, you have to set the seriesType as shape.
<html xmlns="http://www.w3.org/1999/xhtml" lang="en" ng-app="ChartApp">
    <head>
        <title>Essential Studio for AngularJS: Chart</title>
        <!--CSS and Script file References -->
    </head>
    <body ng-controller="ChartCtrl">
        <div id="container" ej-chart e-legend-shape="seriesType">
        </div>
        <script>
        angular.module('ChartApp', ['ejangular'])
        .controller('ChartCtrl', function ($scope) {
                     });
        </script>
    </body>
</html>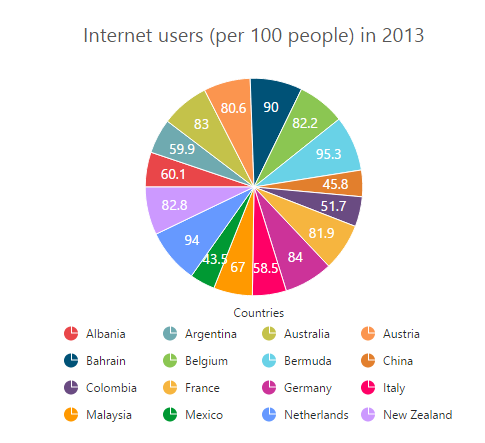
Legend items size and border
You can change the size of the legend items by using the width and height options. To change the legend item border, use border option of the legend itemStyle.
<html xmlns="http://www.w3.org/1999/xhtml" lang="en" ng-app="ChartApp">
    <head>
        <title>Essential Studio for AngularJS: Chart</title>
        <!--CSS and Script file References -->
    </head>
    <body ng-controller="ChartCtrl">
        <div id="container" ej-chart e-legend-itemstyle-width="13"
        e-legend-itemstyle-height="13" e-legend-itemstyle-border-color="#FF0000"
        e-legend-itemstyle-border-width="1">
        </div>
        <script>
        angular.module('ChartApp', ['ejangular'])
        .controller('ChartCtrl', function ($scope) {
                     });
        </script>
    </body>
</html>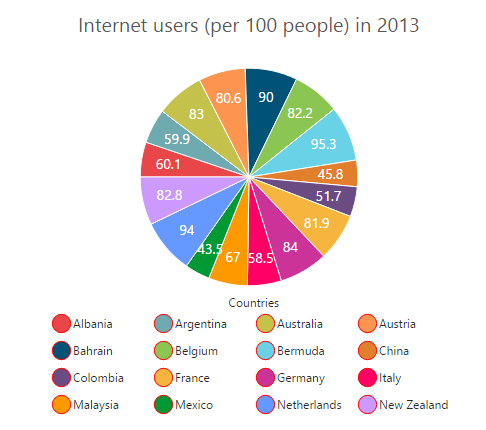
Legend size
By default, legend takes 20% of the height horizontally when it was placed on the top or bottom position and 20% of the width vertically while placing on the left or right position of the chart. You can change this default legend size by using the e-legend-size option of the legend.
<html xmlns="http://www.w3.org/1999/xhtml" lang="en" ng-app="ChartApp">
    <head>
        <title>Essential Studio for AngularJS: Chart</title>
        <!--CSS and Script file References -->
    </head>
    <body ng-controller="ChartCtrl">
        <div id="container" ej-chart e-legend-size-width="550px" e-legend-size-height="100px">
        </div>
        <script>
        angular.module('ChartApp', ['ejangular'])
        .controller('ChartCtrl', function ($scope) {
                     });
        </script>
    </body>
</html>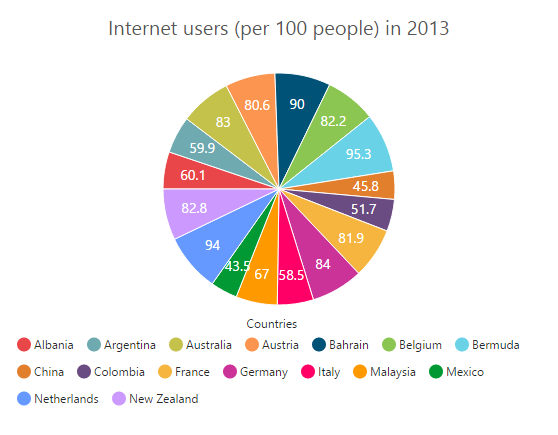
Legend Item Padding
You can control the spacing between the legend items by using the e-legend-itemPadding option of the legend. The default value is 10.
<html xmlns="http://www.w3.org/1999/xhtml" lang="en" ng-app="ChartApp">
    <head>
        <title>Essential Studio for AngularJS: Chart</title>
        <!--CSS and Script file References -->
    </head>
    <body ng-controller="ChartCtrl">
        <div id="container" ej-chart e-legend-itempadding="15">
        </div>
        <script>
        angular.module('ChartApp', ['ejangular'])
        .controller('ChartCtrl', function ($scope) {
                     });
        </script>
    </body>
</html>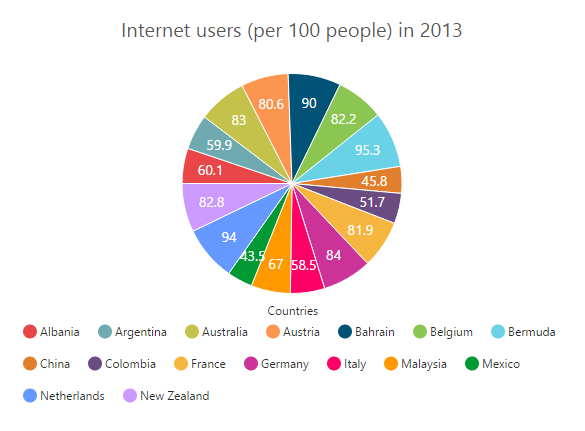
Legend border
You can customize the legend border by using the e-legend-border option in the legend.
<html xmlns="http://www.w3.org/1999/xhtml" lang="en" ng-app="ChartApp">
    <head>
        <title>Essential Studio for AngularJS: Chart</title>
        <!--CSS and Script file References -->
    </head>
    <body ng-controller="ChartCtrl">
        <div id="container" ej-chart e-legend-border-color="#FFC342" e-legend-border-width="2">
        </div>
        <script>
        angular.module('ChartApp', ['ejangular'])
        .controller('ChartCtrl', function ($scope) {
                    });
        </script>
    </body>
</html>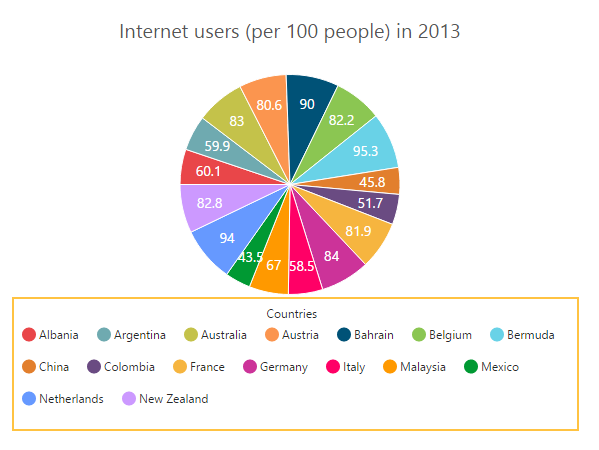
Scrollbar for legend
You can enable or disable the legend scrollbar by using the e-legend-enableScrollbar option of the legend. When you disable the scrollbar option, the legend does not consider the default size and chart draws in the remaining space. If you have specified the size to the legend with the scrollbar disabled, then the legends beyond this limit will get clipped. The default value of e-legend-enableScrollbar option is true.
<html xmlns="http://www.w3.org/1999/xhtml" lang="en" ng-app="ChartApp">
    <head>
        <title>Essential Studio for AngularJS: Chart</title>
        <!--CSS and Script file References -->
    </head>
    <body ng-controller="ChartCtrl">
        <div id="container" ej-chart e-legend-size-width="430px"
        e-legend-size-height="80px" e-legend-enablescrollbar="true">
        </div>
        <script>
        angular.module('ChartApp', ['ejangular'])
        .controller('ChartCtrl', function ($scope) {
                    });
        </script>
    </body>
</html>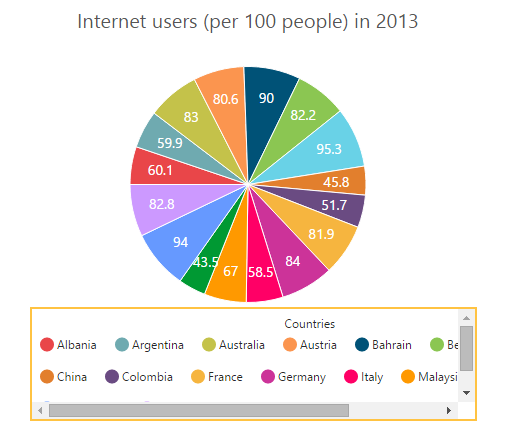
Customize the legend text
To customize the legend item text and title you can use the e-legend-font and e-legend-title options. You can change the legend title alignment by using the e-legend-text-textAlignmentoption of the legend title.
<html xmlns="http://www.w3.org/1999/xhtml" lang="en" ng-app="ChartApp">
    <head>
        <title>Essential Studio for AngularJS: Chart</title>
        <!--CSS and Script file References -->
    </head>
    <body ng-controller="ChartCtrl">
        <div id="container" ej-chart e-legend-font-fontfamily="Segoe UI"
        e-legend-font-fontstyle="normal" e-legend-font-fontweight="bold" e-legend-font-size="15px"
        e-legend-title-textalignment="center" e-legend-title-font-fontfamily="Segoe UI"
        e-legend-title-font-fontstyle="Italic" e-legend-title-font-fontweight="bold"
        e-legend-title-font-size="12px" >
        </div>
        <script>
        angular.module('ChartApp', ['ejangular'])
        .controller('ChartCtrl', function ($scope) {
                    });
        </script>
    </body>
</html>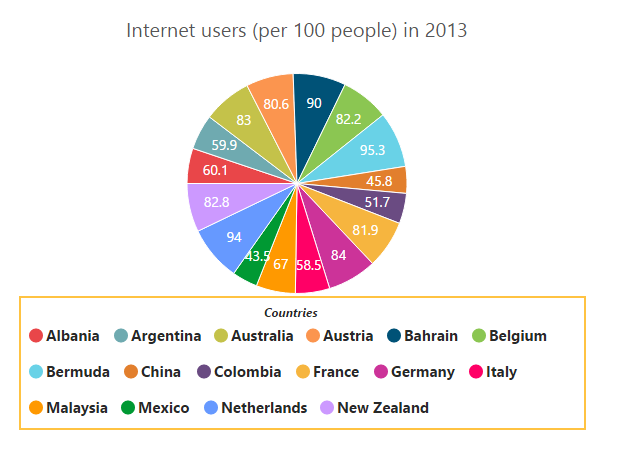
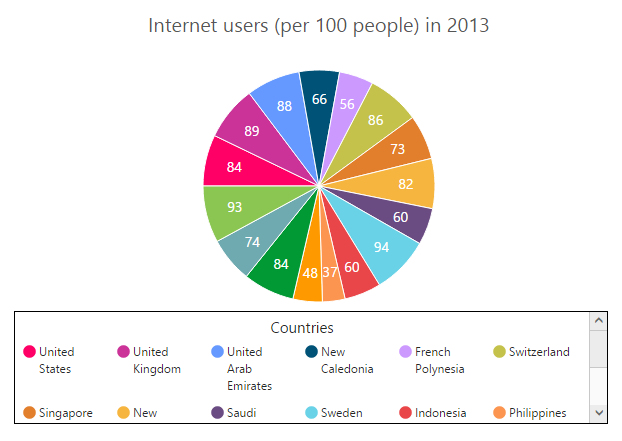
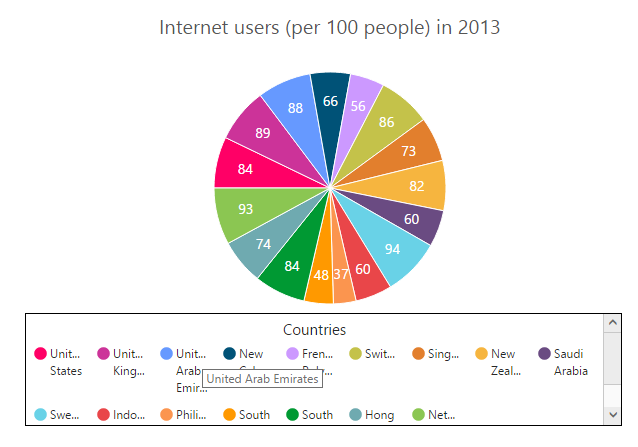
LegendItems Text Overflow
Trim
You can trim the legend item text when its width exceeds the e-legend-textWidth, by specifying e-legend-textOverflow as “trim”. The original text will be displayed on mouse hover.
<html xmlns="http://www.w3.org/1999/xhtml" lang="en" ng-app="ChartApp">
    <head>
        <title>Essential Studio for AngularJS: Chart</title>
        <!--CSS and Script file References -->
    </head>
    <body ng-controller="ChartCtrl">
        <div id="container" ej-chart e-legend-textoverflow="trim" e-legend-textwidth="34">
        </div>
        <script>
        angular.module('ChartApp', ['ejangular'])
        .controller('ChartCtrl', function ($scope) {
                    });
        </script>
    </body>
</html>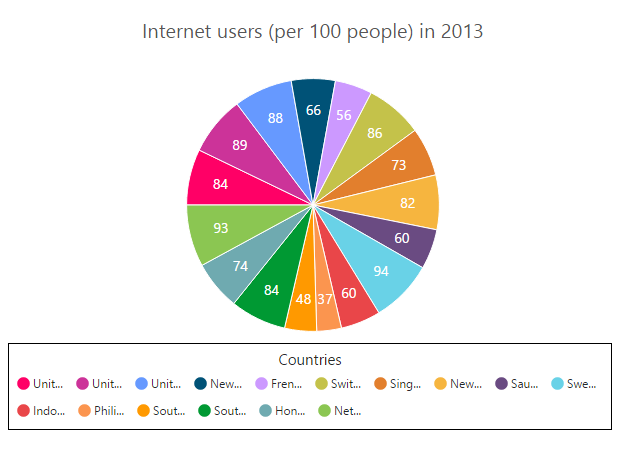
Wrap
By specifying e-legend-textOverflow as “wrap”, you can wrap the legend text by word.
WrapAndTrim
You can wrap and trim the legend text by specifying e-legend-textOverflow as “wrapAndTrim”. The original text will be displayed on mouse hover.
Handle the legend item clicked
You can get the legend item details such as index, bounds, shape and series by subscribing the e-legendItemClick event on the chart. When the legend item is clicked, it triggers the event and returns the legend information.
<html xmlns="http://www.w3.org/1999/xhtml" lang="en" ng-app="ChartApp">
    <head>
        <title>Essential Studio for AngularJS: Chart</title>
        <!--CSS and Script file References -->
    </head>
    <body ng-controller="ChartCtrl">
        <div id="container" ej-chart e-legenditemclick=onLegendClicked>
        </div>
        <script>
        angular.module('ChartApp', ['ejangular'])
        .controller('ChartCtrl', function ($scope) {
                    $scope.onLegendClicked="onLegendClicked";
                    });
        function onLegendClicked(sender) {
        //Get legend item details on legend item click.
        var legendItem = sender.data;
        }
        </script>
    </body>
</html>
Series selection on legend item click
You can select a specific series or point while clicking on the corresponding legend item through disabling the e-toggleSeriesVisibility option of the legend. The default value of toggleSeriesVisibility option is true. To customize the series selection refer to the series e-series-selection
<html xmlns="http://www.w3.org/1999/xhtml" lang="en" ng-app="ChartApp">
    <head>
        <title>Essential Studio for AngularJS: Chart</title>
        <!--CSS and Script file References -->
    </head>
    <body ng-controller="ChartCtrl">
        <div id="container" ej-chart e-toggleseriesvisibility="false">
        </div>
        <script>
        angular.module('ChartApp', ['ejangular'])
        .controller('ChartCtrl', function ($scope) {
                    });
    </script>
    </body>
</html>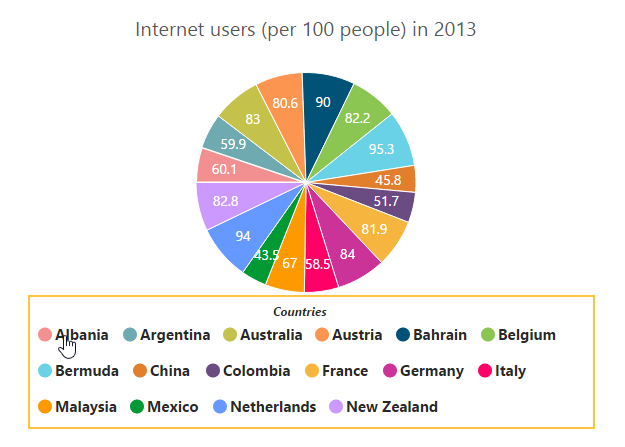
Collapsing legend item
You can collapse the specific series/point legend item displaying in the chart, by setting the visibleOnLegend as “hidden” in the point or series.
<html xmlns="http://www.w3.org/1999/xhtml" lang="en" ng-app="ChartApp">
    <head>
        <title>Essential Studio for AngularJS: Chart</title>
        <!--CSS and Script file References -->
    </head>
    <body ng-controller="ChartCtrl">
        <div id="container" ej-chart  e-legend-visible="true">
        <e-series>
        <e-series>
        <e-points>
        <e-points e-x="Albania" e-y="60.1"></e-points>
          //...
           //Collapse the point's legend item in the legend collection
        <e-points e-x="New Zealand" e-y="82.8" e-visibleOnLegend="hidden"></e-points>
        </e-points>
        </e-series>
        </e-series>
        </div>
        <script>
        angular.module('ChartApp', ['ejangular'])
        .controller('ChartCtrl', function ($scope) {

            });
        </script>
    </body>
</html>