Multiple panes
28 Jun 20178 minutes to read
Chart area can be divided into multiple panes using the e-rowDefinitions and e-columnDefinitions properties.
Row Definitions
To split the chart area vertically into a number of rows, use e-rowDefinitions of the chart.
-
You can allocate space for each row by using the
unitoption that determines whether the chart area should be split by percentage or pixels for the givenrowHeightvalue of the rowDefinitions. -
To associate a vertical axis to a row, specify the rowDefinitions index value to the
e-rowIndexproperty of the chart axis. -
To customize each row’s horizontal line, use
lineColorandlineWidthproperty.
<html xmlns="http://www.w3.org/1999/xhtml" lang="en" ng-app="ChartApp">
    <head>
        <title>Essential Studio for AngularJS: Chart</title>
        <!--CSS and Script file References -->
    </head>
    <body ng-controller="ChartCtrl">
        <div id="container" ej-chart>
        <e-rowdefinitions>
        <e-rowdefinition e-unit="percentage" e-linecolor="Gray" e-rowheight="50"
        e-linewidth="0"></e-rowdefinition>
        <e-rowdefinition e-unit="percentage" e-linecolor="green" e-rowheight="50"
        e-linewidth="0"></e-rowdefinition>
        <e-rowdefinitions>
        <e-axes>
        <e-axis e-name="yAxis1" e-rowindex="1">
        </e-axes>
        <e-series>
        <e-series e-yAxisName="yAxis1"></e-series>
        </e-series>
        </div>
        <script>
        angular.module('ChartApp', ['ejangular'])
        .controller('ChartCtrl', function ($scope) {

                   });
        </script>
    </body>
</html>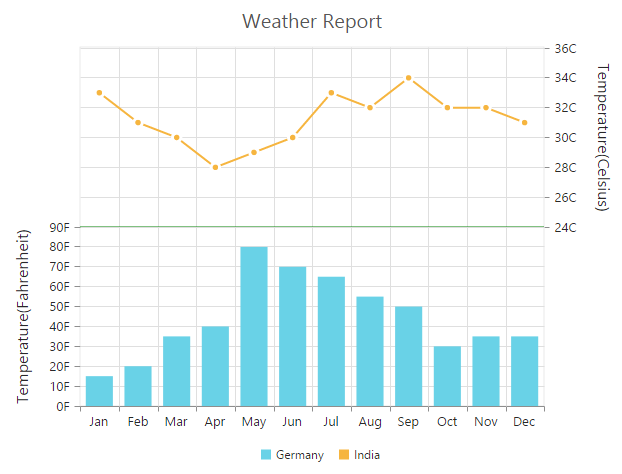
Row Span
For spanning the vertical axis along multiple panes vertically, you can use e-primaryyaxis-rowSpan property of axis.
<html xmlns="http://www.w3.org/1999/xhtml" lang="en" ng-app="ChartApp">
    <head>
        <title>Essential Studio for AngularJS: Chart</title>
        <!--CSS and Script file References -->
    </head>
    <body ng-controller="ChartCtrl">
        <div id="container" ej-chart  e-primaryyaxis-rowspan="2" >
        <e-rowdefinitions>
         //...
        <e-rowdefinitions>
        <e-axes>
        <e-axis ></e-axis>
        </e-axes>
        <e-series>
        <e-series e-yAxisName="yAxis1"></e-series>
        </e-series>
        </div>
        <script>
                angular.module('ChartApp', ['ejangular'])
                .controller('ChartCtrl', function ($scope) {

                   });
        </script>
    </body>
</html>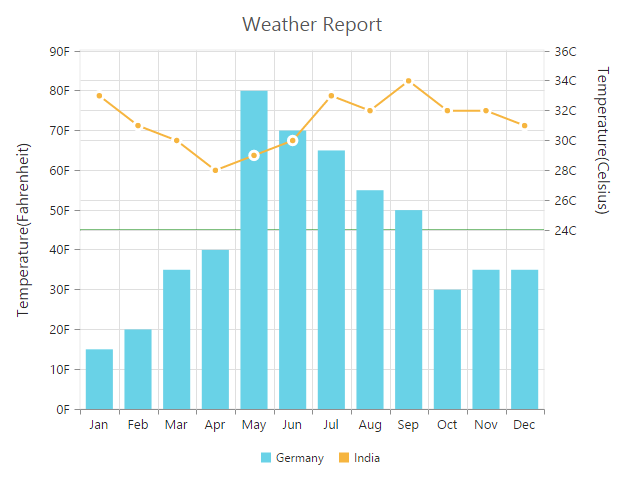
Column Definitions
To split the chart area horizontally into a number of columns, use e-columnDefinitions of the chart.
-
You can allocate space for each column by using the
unitoption that determines whether the chart area should be split by percentage or pixels for the givencolumnWidthvalue of the columnDefinitions. -
To associate a horizontal axis to a column, specify the columnDefinitions index value to the
e-columnIndexproperty of the chart axis.
<html xmlns="http://www.w3.org/1999/xhtml" lang="en" ng-app="ChartApp">
    <head>
        <title>Essential Studio for AngularJS: Chart</title>
        <!--CSS and Script file References -->
    </head>
    <body ng-controller="ChartCtrl">
        <div id="container" ej-chart>
        <e-columndefinitions>
        <e-columndefinition e-unit="percentage" e-columnwidth="50">
        </e-columndefinition>
        <e-columndefinition e-unit="percentage"  e-columnwidth="50">
        </e-columndefinition>
        <e-columndefinitions>
        <e-axes>
        <e-axis e-name="xAxis1" e-columnindex="1">
        </e-axes>
        <e-series>
        <e-series e-xAxisName="yAxis1"></e-series>
        </e-series>
        </div>
        <script>
         angular.module('ChartApp', ['ejangular'])
         .controller('ChartCtrl', function ($scope) {

                   });
        </script>
    </body>
</html>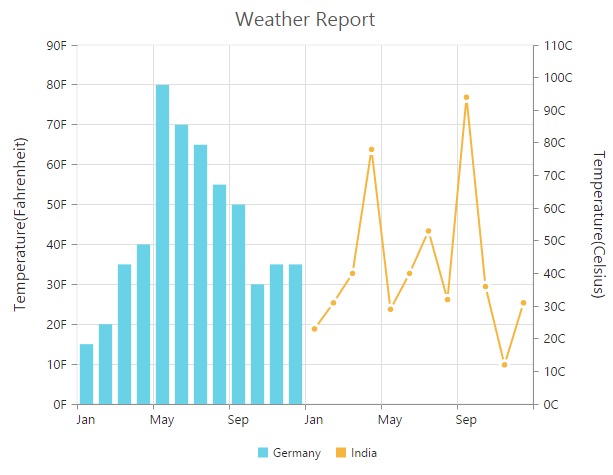
Column Span
For spanning the horizontal axis along multiple panes horizontally, you can use e-columnSpan property of axis.
<html xmlns="http://www.w3.org/1999/xhtml" lang="en" ng-app="ChartApp">
    <head>
        <title>Essential Studio for AngularJS: Chart</title>
        <!--CSS and Script file References -->
    </head>
    <body ng-controller="ChartCtrl">
        <div id="container" ej-chart  e-primaryxaxis-columnspan="2" >
        <e-columndefinitions>
        // ..
        <e-columndefinitions>
        <e-axes>
        <e-axis ></e-axis>
        </e-axes>
        <e-series>
        <e-series e-xAxisName="xAxis1"></e-series>
        </e-series>
        </div>
        <script>
         angular.module('ChartApp', ['ejangular'])
         .controller('ChartCtrl', function ($scope) {
         });
        </script>
    </body>
</html>