Working with Data
28 Jun 20177 minutes to read
Local Data
There are two ways to provide local data to chart.
1.Typically, you will assign data directly to chart using e-dataSource property of the series. In AngularJS, you need to bind the variable, which contains data in the AngularJS scope object, to the dataSource property as illustrated in the following code example,
IMPORTANT
Essential JS includes AngularJS directives for all controls in the ej.widget.angular.min.js script file.
NOTE
All the properties in EjChart supports one way AngularJS binding except inner array properties like series.points[], series.trendlines[]. Click here to know more about Essential AngularJS and the properties which support two way AngularJS binding in chart.
<html xmlns="http://www.w3.org/1999/xhtml" lang="en" ng-app="ChartApp">
    <head>
        <title>Essential Studio for AngularJS: Chart</title>
        <!--CSS and Script file References -->
    </head>
    <body ng-controller="ChartCtrl">
        <div id="container" ej-chart>
         <e-series>
            <e-series e-datasource=dataSource e-xname="month" e-yname="sales">
            </e-series>
        </e-series>
    </div>
    </body>
</html><script>
var ChartData =
[{ month: 'Jan', sales: 35 }, { month: 'Feb', sales: 28 }, { month: 'Mar', sales: 34 },
{ month: 'Apr', sales: 32 },{ month: 'May', sales: 40 },{ month: 'Jun', sales: 32 },
{ month: 'Jul', sales: 35 }, { month: 'Aug', sales: 55 }, { month: 'Sep', sales: 38 },
{ month: 'Oct', sales: 30 }, { month: 'Nov', sales: 25 }, { month: 'Dec', sales: 32 }];
angular.module('ChartApp', ['ejangular'])
.controller('ChartCtrl', function ($scope) {
$scope.dataSource = chartData;
});
</script>
2.You can also plot data to chart using e-points option in the series. Using this property you can customize each and every point in the data.
<html xmlns="http://www.w3.org/1999/xhtml" lang="en" ng-app="ChartApp">
    <head>
        <title>Essential Studio for AngularJS: Chart</title>
        <!--CSS and Script file References -->
    </head>
    <body ng-controller="ChartCtrl">
        <div id="container" ej-chart >
        <e-series>
        <e-series >
        <e-points>
        <e-points e-x="John" e-y="10000"></e-points>
        <e-points e-x="Jake" e-y="12000"></e-points>
        <e-points e-x="Peter" e-y="18000"></e-points>
        <e-points e-x="James" e-y="11000"></e-points>
        <e-points e-x="Mary" e-y="9700"></e-points>
        </e-points>
        </e-series>
        </e-series>
        </div>
    </body>
</html><script>
angular.module('ChartApp', ['ejangular'])
.controller('ChartCtrl', function ($scope) {
});
</script>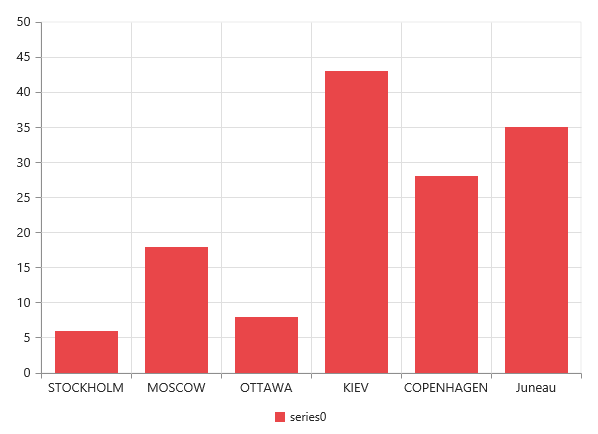
Remote Data
You can bind the remote data to the chart by using the DataManager and you can use the e-query property of the series to filter the data from the dataSource.
<html xmlns="http://www.w3.org/1999/xhtml" lang="en" ng-app="ChartApp">
    <head>
        <title>Essential Studio for AngularJS: Chart</title>
        <!--CSS and Script file References -->
    </head>
    <body ng-controller="ChartCtrl">
        <div id="container" ej-chart>
         <e-series>
            <e-series e-datasource=dataSource e-xname="ShipCity" e-yname="Freight" e-query= query>
            </e-series>
        </e-series>
    </div>
    </body>
</html><script>
var dataManger = ej.DataManager({
url: "http://mvc.syncfusion.com/Services/Northwnd.svc/"
});
// Query creation
var query = ej.Query().from("Orders").take(6);
angular.module('ChartApp', ['ejangular'])
.controller('ChartCtrl', function ($scope) {
$scope.dataSource = dataManger;
$scope.query = query;
});
</script>