Trendlines
28 Jun 201721 minutes to read
EjChart can generate Trendlines for Cartesian type series (Line, Column, Scatter, Area, Candle, HiLo etc.) except bar type series. You can add more than one trendline object to the e-trendlines option.
<html xmlns="http://www.w3.org/1999/xhtml" lang="en" ng-app="ChartApp">
    <head>
        <title>Essential Studio for AngularJS: Chart</title>
        <!--CSS and Script file References -->
    </head>
    <body ng-controller="ChartCtrl">
        <div id="container" ej-chart >
        <e-series>
        <e-series e-trendlines="trendline"></e-series>
        </e-series>
        </div>
        <script>
                angular.module('ChartApp', ['ejangular'])
                .controller('ChartCtrl', function ($scope) {
                  $scope.trendlines=[{
                       //Enable Trendline to chart series
                       visibility: "visible", type: "linear"
                     }];
                   });
        </script>
    </body>
</html>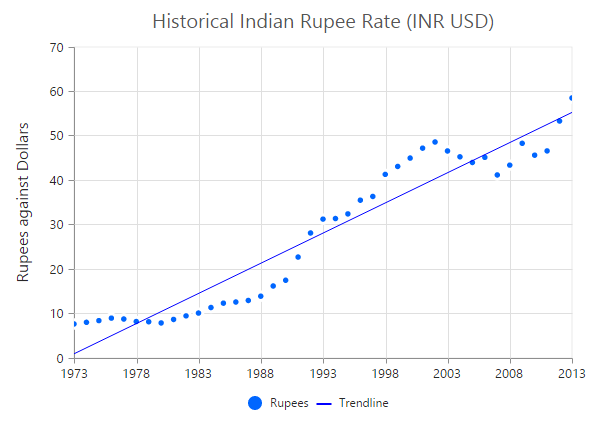
Customize the trendline styles
A trendline can be customized by using the properties such as fill, width, dashArray and opacity. The default type of trendline is “linear”.
<html xmlns="http://www.w3.org/1999/xhtml" lang="en" ng-app="ChartApp">
    <head>
        <title>Essential Studio for AngularJS: Chart</title>
        <!--CSS and Script file References -->
    </head>
    <body ng-controller="ChartCtrl">
        <div id="container" ej-chart >
        <e-series>
        <e-series e-trendlines="trendline"></e-series>
        </e-series>
        </div>
        <script>
                angular.module('ChartApp', ['ejangular'])
                .controller('ChartCtrl', function ($scope) {
                  $scope.trendlines=[{
                         //Customize the Trendline styles
                         fill: '#99CCFF', width: 3, opacity: 1, dashArray: '2,3'
                     }];
                   });
        </script>
    </body>
</html>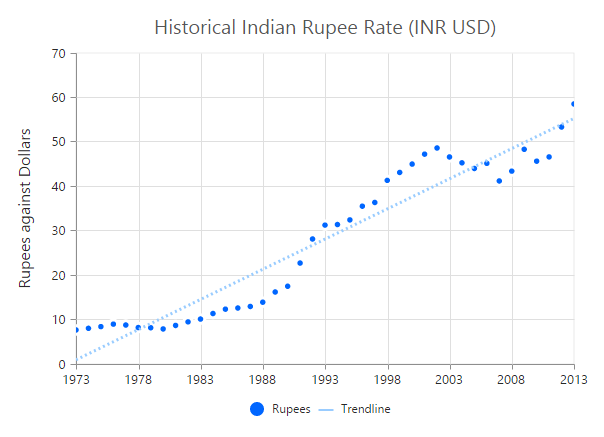
Types of Trendline
EjChart supports the following type of Trendlines.
- Linear
- Exponential
- Logarithmic
- Power
- Polynomial
- MovingAverage
Linear
To render Linear Trendline, you have to set the type as “linear”.
<html xmlns="http://www.w3.org/1999/xhtml" lang="en" ng-app="ChartApp">
    <head>
        <title>Essential Studio for AngularJS: Chart</title>
        <!--CSS and Script file References -->
    </head>
    <body ng-controller="ChartCtrl">
        <div id="container" ej-chart >
        <e-series>
        <e-series e-trendlines="trendline"></e-series>
        </e-series>
        </div>
        <script>
                angular.module('ChartApp', ['ejangular'])
                .controller('ChartCtrl', function ($scope) {
                  $scope.trendlines=[{
                         //Change the Trendline type
                         type:"linear"
                     }];
                   });
        </script>
    </body>
</html>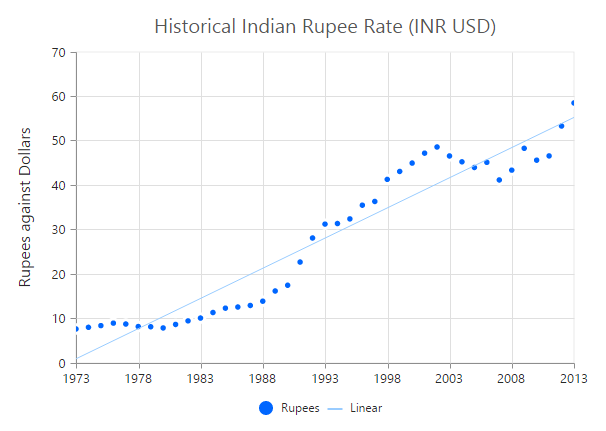
Exponential
Exponential Trendline can be rendered by setting the type as “exponential”.
<html xmlns="http://www.w3.org/1999/xhtml" lang="en" ng-app="ChartApp">
    <head>
        <title>Essential Studio for AngularJS: Chart</title>
        <!--CSS and Script file References -->
    </head>
    <body ng-controller="ChartCtrl">
        <div id="container" ej-chart >
        <e-series>
        <e-series e-trendlines="trendline"></e-series>
        </e-series>
        </div>
        <script>
                angular.module('ChartApp', ['ejangular'])
                .controller('ChartCtrl', function ($scope) {
                  $scope.trendlines=[{
                         //Change the Trendline type
                         type:"exponential"
                     }];
                   });
        </script>
    </body>
</html>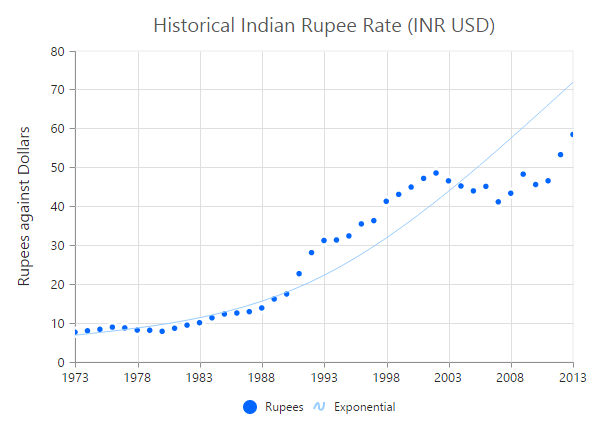
Logarithmic
Logarithmic Trendline can be rendered by setting the type as “Logarithmic”.
<html xmlns="http://www.w3.org/1999/xhtml" lang="en" ng-app="ChartApp">
    <head>
        <title>Essential Studio for AngularJS: Chart</title>
        <!--CSS and Script file References -->
    </head>
    <body ng-controller="ChartCtrl">
        <div id="container" ej-chart >
        <e-series>
        <e-series e-trendlines="trendline"></e-series>
        </e-series>
        </div>
        <script>
                angular.module('ChartApp', ['ejangular'])
                .controller('ChartCtrl', function ($scope) {
                  $scope.trendlines=[{
                         //Change the Trendline type
                         type:"logarithmic"
                     }];
                   });
        </script>
    </body>
</html>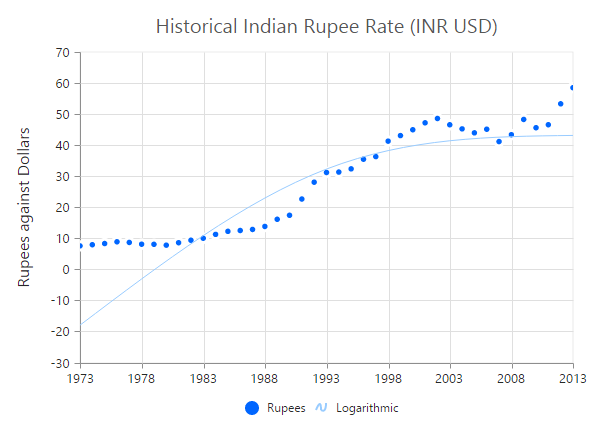
Power
Power Trendline can be rendered by setting the type of the trendline as “power”.
<html xmlns="http://www.w3.org/1999/xhtml" lang="en" ng-app="ChartApp">
    <head>
        <title>Essential Studio for AngularJS: Chart</title>
        <!--CSS and Script file References -->
    </head>
    <body ng-controller="ChartCtrl">
        <div id="container" ej-chart >
        <e-series>
        <e-series e-trendlines="trendline"></e-series>
        </e-series>
        </div>
        <script>
                angular.module('ChartApp', ['ejangular'])
                .controller('ChartCtrl', function ($scope) {
                  $scope.trendlines=[{
                         //Change the Trendline type
                         type:"power"
                     }];
                   });
        </script>
    </body>
</html>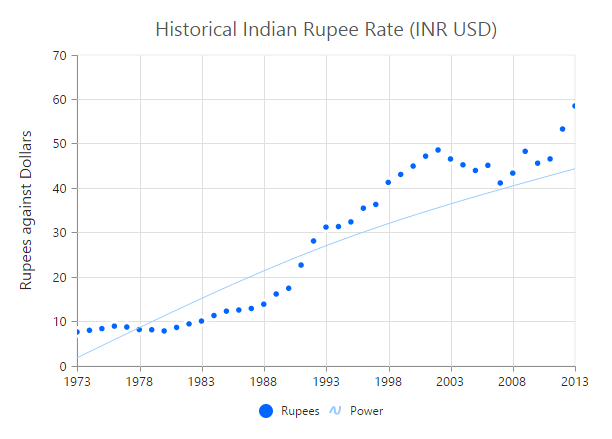
Polynomial
Polynomial Trendline can be rendered by setting the trendline type as “polynomial”. You can change the polynomial order by using the polynomialOrder of the trendlines. It ranges from 2 to 6.
<html xmlns="http://www.w3.org/1999/xhtml" lang="en" ng-app="ChartApp">
    <head>
        <title>Essential Studio for AngularJS: Chart</title>
        <!--CSS and Script file References -->
    </head>
    <body ng-controller="ChartCtrl">
        <div id="container" ej-chart >
        <e-series>
        <e-series e-trendlines="trendline"></e-series>
        </e-series>
        </div>
        <script>
                angular.module('ChartApp', ['ejangular'])
                .controller('ChartCtrl', function ($scope) {
                  $scope.trendlines=[{
                         //Change the Trendline type
                         type:"polynomial"
                     }];
                   });
        </script>
    </body>
</html>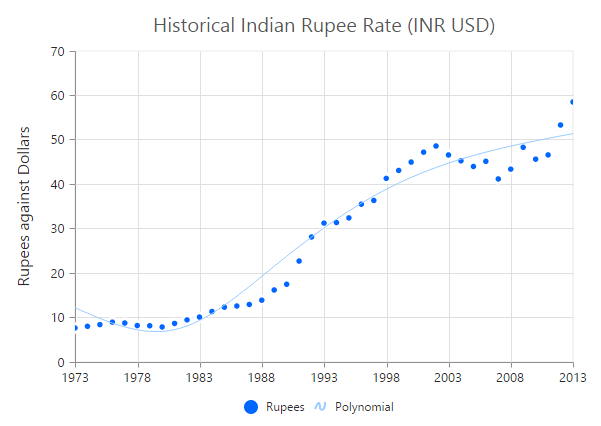
MovingAverage
MovingAverage Trendline can be rendered by setting the type of the trendline as “movingAverage”.
<html xmlns="http://www.w3.org/1999/xhtml" lang="en" ng-app="ChartApp">
    <head>
        <title>Essential Studio for AngularJS: Chart</title>
        <!--CSS and Script file References -->
    </head>
    <body ng-controller="ChartCtrl">
        <div id="container" ej-chart >
        <e-series>
        <e-series e-trendlines="trendline"></e-series>
        </e-series>
        </div>
        <script>
                angular.module('ChartApp', ['ejangular'])
                .controller('ChartCtrl', function ($scope) {
                  $scope.trendlines=[{
                         //Change the Trendline type
                         type:"movingAverage",
                         period:"3"
                     }];
                   });
        </script>
    </body>
</html>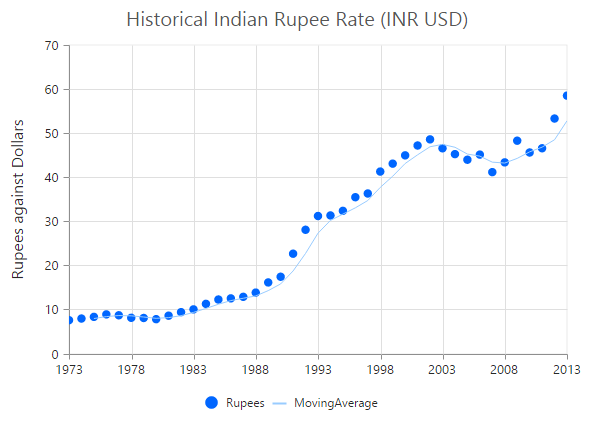
Forecasting
Trendline forecasting is the prediction of future/past situations. Forecasting can be classified into two types as follows.
- Forward Forecasting
- Backward Forecasting
Forward Forecasting
The value set for forwardForecast is used to determine the distance moving towards the future trend.
<html xmlns="http://www.w3.org/1999/xhtml" lang="en" ng-app="ChartApp">
    <head>
        <title>Essential Studio for AngularJS: Chart</title>
        <!--CSS and Script file References -->
    </head>
    <body ng-controller="ChartCtrl">
        <div id="container" ej-chart >
        <e-series>
        <e-series e-trendlines="trendline"></e-series>
        </e-series>
        </div>
        <script>
                angular.module('ChartApp', ['ejangular'])
                .controller('ChartCtrl', function ($scope) {
                  $scope.trendlines=[{
                         //Set the Forward forecasting value
                        forwardForecast:5
                     }];
                   });
        </script>
    </body>
</html>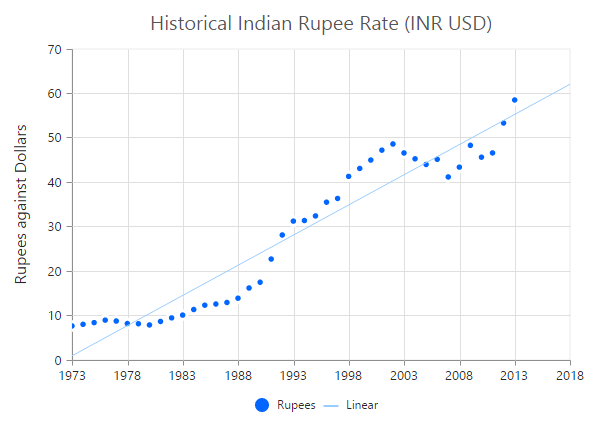
Backward Forecasting
The value set for the backwardForecast is used to determine the past trends.
<html xmlns="http://www.w3.org/1999/xhtml" lang="en" ng-app="ChartApp">
    <head>
        <title>Essential Studio for AngularJS: Chart</title>
        <!--CSS and Script file References -->
    </head>
    <body ng-controller="ChartCtrl">
        <div id="container" ej-chart >
        <e-series>
        <e-series e-trendlines="trendline"></e-series>
        </e-series>
        </div>
        <script>
                angular.module('ChartApp', ['ejangular'])
                .controller('ChartCtrl', function ($scope) {
                  $scope.trendlines=[{
                         //Set the Backward forecasting value
                        backwardForecast:5
                     }];
                   });
        </script>
    </body>
</html>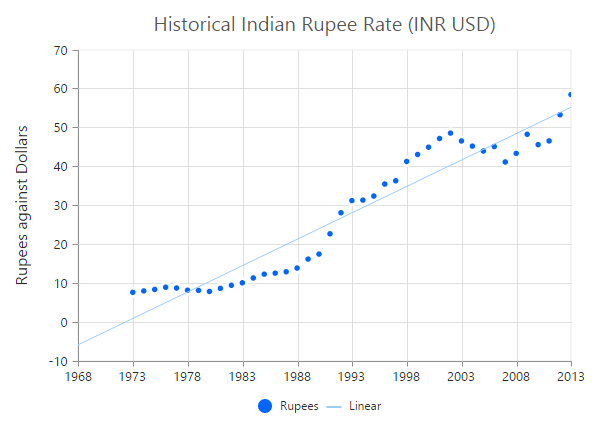
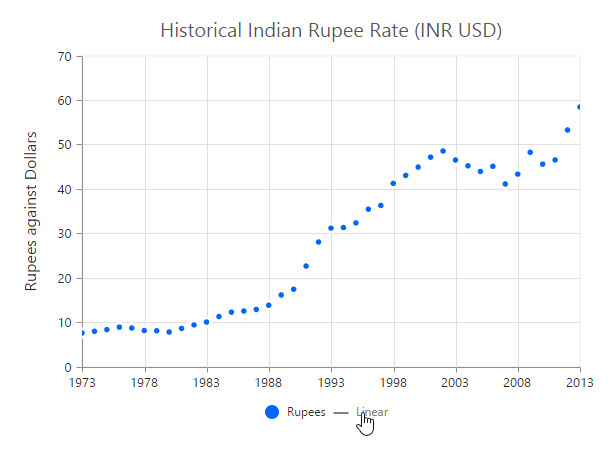
Trendlines Legend
To display the legend item for trendline, use the name property. You can interact with the trendline legends similar to the series legends (show/hide trendlines on legend click).
<html xmlns="http://www.w3.org/1999/xhtml" lang="en" ng-app="ChartApp">
    <head>
        <title>Essential Studio for AngularJS: Chart</title>
        <!--CSS and Script file References -->
    </head>
    <body ng-controller="ChartCtrl">
        <div id="container" ej-chart >
        <e-series>
        <e-series e-trendlines="trendline"></e-series>
        </e-series>
        </div>
        <script>
                angular.module('ChartApp', ['ejangular'])
                .controller('ChartCtrl', function ($scope) {
                  $scope.trendlines=[{
                         //...
                       //Set Trendline name to display in the legend
                       name: 'Linear'
                     }];
                   });
        </script>
    </body>
</html>