How can I help you?
Localization
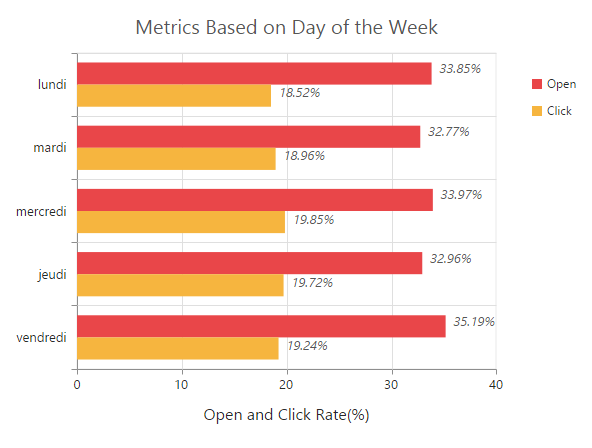
EjChart supports localization for its axis labels and tooltip. To render the chart with specific culture you have to refer the corresponding globalize culture script and need to specify the culture name in e-locale property of chart.
<html xmlns="http://www.w3.org/1999/xhtml" lang="en" ng-app="ChartApp">
    <head>
        <title>Essential Studio for AngularJS: Chart</title>
        <!--CSS and Script file References -->
        <!--Refer french globalize culture script-->
    <script src="../scripts/cultures/globalize.culture.fr-FR.min.js"></script>
    </head>
    <body ng-controller="ChartCtrl">
        <div id="container" ej-chart  e-locale="fr-FR">
        </div>
        <script>
        angular.module('ChartApp', ['ejangular'])
        .controller('ChartCtrl', function ($scope) {
                        });
        </script>
    </body>
</html>