Appearance
3 Aug 201716 minutes to read
Custom Color Palette
The Chart displays different series in different colors by default. You can customize the color of each series by providing a custom color palette of your choice by using the e-paletteproperty.
<html xmlns="http://www.w3.org/1999/xhtml" lang="en" ng-app="ChartApp">
    <head>
        <title>Essential Studio for AngularJS: Chart</title>
        <!--CSS and Script file References -->
    </head>
    <body ng-controller="ChartCtrl">
        <div id="container" ej-chart e-palette="palette" >
        </div>
        <script>
        angular.module('ChartApp', ['ejangular'])
        .controller('ChartCtrl', function ($scope) {
         $scope.palette=[{ "grey", "skyblue", "orange"}];
                   });
        </script>
    </body>
</html>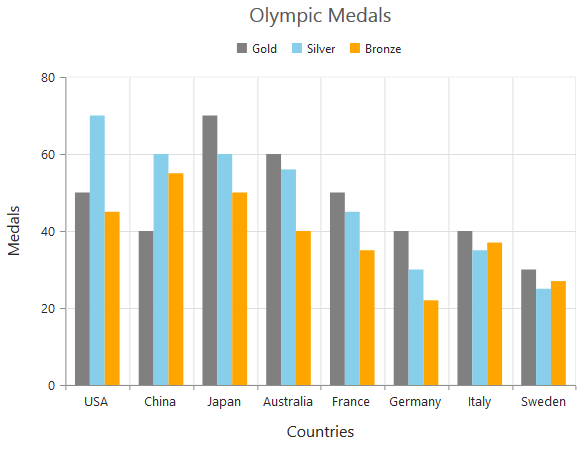
NOTE
The Color palette is applied to the points in accumulation type series
Built-in Themes
Following are the built-in themes available in the Chart
- flatlight
- flatdark
- gradientlight
- gradientdark
- azure
- azuredark
- lime
- limedark
- saffron
- saffrondark
- gradient-azure
- gradient-azuredark
- gradient-lime
- gradient-limedark
- gradient-saffron
- gradient-saffrondark
You can set your desired theme by using the e-theme property. Flat light is the default theme used in the Chart.
<html xmlns="http://www.w3.org/1999/xhtml" lang="en" ng-app="ChartApp">
    <head>
        <title>Essential Studio for AngularJS: Chart</title>
        <!--CSS and Script file References -->
    </head>
    <body ng-controller="ChartCtrl">
        <div id="container" ej-chart e-theme="gradientlight" >
        </div>
        <script>
        angular.module('ChartApp', ['ejangular'])
        .controller('ChartCtrl', function ($scope) {
                         });
        </script>
    </body>
</html>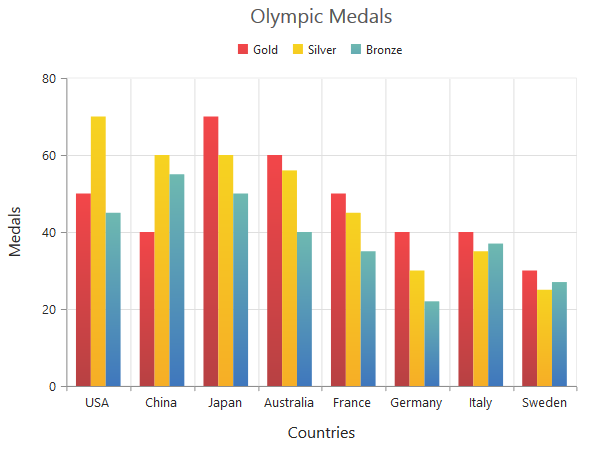
Point level customization
Marker, data label and fill color of each point in a series can be customized individually by using the e-points collection.
<html xmlns="http://www.w3.org/1999/xhtml" lang="en" ng-app="ChartApp">
    <head>
        <title>Essential Studio for AngularJS: Chart</title>
        <!--CSS and Script file References -->
    </head>
    <body ng-controller="ChartCtrl">
        <div id="container" ej-chart >
        <e-series>
        <e-series>
        <e-points>
        <e-points e-x="0" e-y="210" e-fill="#E27F2D" e-marker-visible="true" >
        </e-points>
        </e-series>
        </e-series>
        </div>
        <script>
        angular.module('ChartApp', ['ejangular'])
        .controller('ChartCtrl', function ($scope) {
        });
        </script>
    </body>
</html>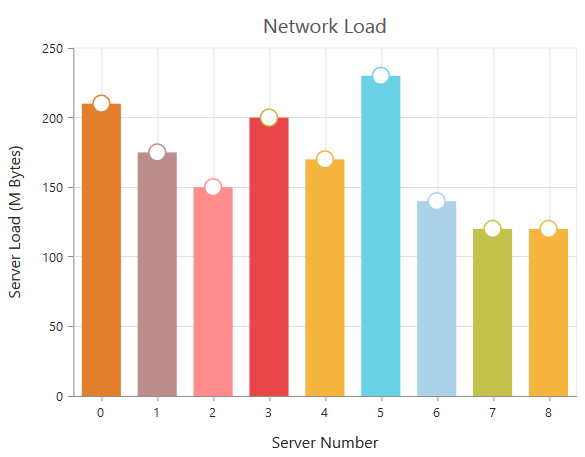
Series border customization
To customize the series border color, width and dashArray, you can use e-series-border option.
NOTE
Series border can be applied to all the series (except Line, Spline, HiLo, HiLoOpenClose and StepLine series).
<html xmlns="http://www.w3.org/1999/xhtml" lang="en" ng-app="ChartApp">
    <head>
        <title>Essential Studio for AngularJS: Chart</title>
        <!--CSS and Script file References -->
    </head>
    <body ng-controller="ChartCtrl">
        <div id="container" ej-chart >
        <e-series>
        <e-series e-series-border-color="blue" e-series-border-width="2"
        e-series-border-dasharray="5,3"></e-series>
        </e-series>
        </div>
        <script>
        angular.module('ChartApp', ['ejangular'])
        .controller('ChartCtrl', function ($scope) {
                  });
        </script>
    </body>
</html>
Chart area customization
Customize chart background
The Chart background can be customized by using the e-background property of the Chart. To customize the chart border, use e-border option of the chart.
<html xmlns="http://www.w3.org/1999/xhtml" lang="en" ng-app="ChartApp">
    <head>
        <title>Essential Studio for AngularJS: Chart</title>
        <!--CSS and Script file References -->
    </head>
    <body ng-controller="ChartCtrl">
        <div id="container" ej-chart e-background="skyblue" e-border-color="#FF0000"
        e-border-width="2" e-border-opacity="0.35">
        </div>
        <script>
        angular.module('ChartApp', ['ejangular'])
        .controller('ChartCtrl', function ($scope) {
                         });
        </script>
    </body>
</html>
Chart Margin
The Chart e-margin property is used to add the margin to the chart area at the left, right, top and bottom position.
<html xmlns="http://www.w3.org/1999/xhtml" lang="en" ng-app="ChartApp">
    <head>
        <title>Essential Studio for AngularJS: Chart</title>
        <!--CSS and Script file References -->
    </head>
    <body ng-controller="ChartCtrl">
        <div id="container" ej-chart e-margin-left="40" e-margin-top="40"
        e-margin-right="40" e-margin-bottom="40">
        </div>
        <script>
        angular.module('ChartApp', ['ejangular'])
        .controller('ChartCtrl', function ($scope) {
                    });
        </script>
    </body>
</html>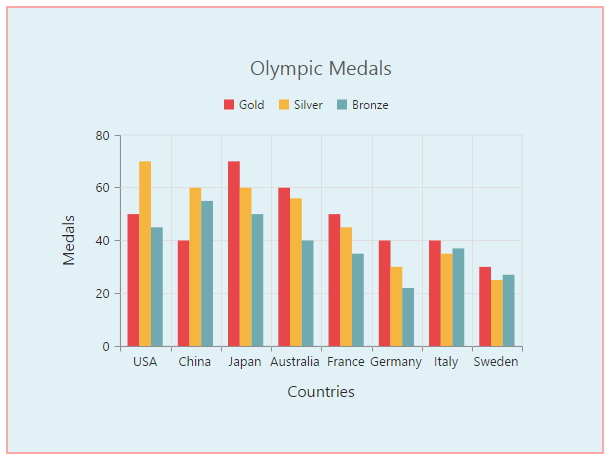
Setting background image
Background image can be added to the chart by using the e-backGroundImageUrl property.
<html xmlns="http://www.w3.org/1999/xhtml" lang="en" ng-app="ChartApp">
    <head>
        <title>Essential Studio for AngularJS: Chart</title>
        <!--CSS and Script file References -->
    </head>
    <body ng-controller="ChartCtrl">
        <div id="container" ej-chart e-backgroundimageurl="images/chart/wheat.png">
        </div>
        <script>
        angular.module('ChartApp', ['ejangular'])
        .controller('ChartCtrl', function ($scope) {
                    });
        </script>
    </body>
</html>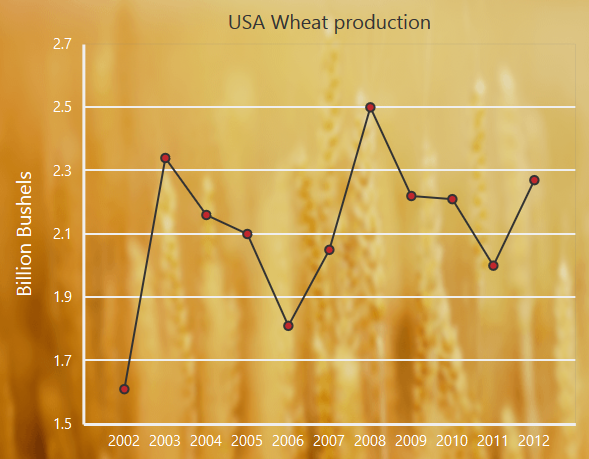
Chart area background
The Chart area background can be customized by using the e-chartarea-backgroundproperty .
<html xmlns="http://www.w3.org/1999/xhtml" lang="en" ng-app="ChartApp">
    <head>
        <title>Essential Studio for AngularJS: Chart</title>
        <!--CSS and Script file References -->
    </head>
    <body ng-controller="ChartCtrl">
        <div id="container" ej-chart e-chartarea-background="skyblue">
        </div>
        <script>
        angular.module('ChartApp', ['ejangular'])
        .controller('ChartCtrl', function ($scope) {
                         });
        </script>
    </body>
</html>
Customize chart area grid bands
You can provide different color for alternate grid rows and columns formed by the grid lines in the chart area by using the e-primaryyaxis-alternateGridBand property of the axis. The properties odd and even are used to customize the grid bands at odd and even positions respectively.
<html xmlns="http://www.w3.org/1999/xhtml" lang="en" ng-app="ChartApp">
    <head>
        <title>Essential Studio for AngularJS: Chart</title>
        <!--CSS and Script file References -->
    </head>
    <body ng-controller="ChartCtrl">
        <div id="container" ej-chart e-primaryyaxis-alternategridband-even-fill="#A7A9AB"
        e-primaryyaxis-alternategridband-even-opacity="0.1">
        </div>
        <script>
        angular.module('ChartApp', ['ejangular'])
        .controller('ChartCtrl', function ($scope) {
                  });
        </script>
    </body>
</html>
Animation
You can enable animation by using the e-enableAnimationproperty of the series. This animates the chart series on two occasions – when the chart is loaded for the first time or whenever you change the series type by using the type property.
<html xmlns="http://www.w3.org/1999/xhtml" lang="en" ng-app="ChartApp">
    <head>
        <title>Essential Studio for AngularJS: Chart</title>
        <!--CSS and Script file References -->
    </head>
    <body ng-controller="ChartCtrl">
        <div id="container" ej-chart >
        <e-series>
        <e-series e-enableanimation="true"></e-series>
        </e-series>
        </div>
        <script>
        angular.module('ChartApp', ['ejangular'])
        .controller('ChartCtrl', function ($scope) {
                     });
        </script>
    </body>
</html>
However, you can force the chart to animate series by calling the animate method as illustrated in the following code example,
<html xmlns="http://www.w3.org/1999/xhtml" lang="en" ng-app="ChartApp">
    <head>
        <title>Essential Studio for AngularJS: Chart</title>
        <!--CSS and Script file References -->
    </head>
    <body ng-controller="ChartCtrl">
        <div id="container" ej-chart >
        <e-series>
        <e-series e-enableanimation="true"></e-series>
        </e-series>
        </div>
        <script>
        angular.module('ChartApp', ['ejangular'])
        .controller('ChartCtrl', function ($scope) {
                    });
                                //Dynamically animating Chart
        function animateChart(){
           //Calling the animate method for dynamic animation
        $("#container").ejChart("animate");
              }
        </script>
    </body>
</html>
Control the Speed of animation
To control the speed of animation, you can use the e-animationDuration property in the series.
<html xmlns="http://www.w3.org/1999/xhtml" lang="en" ng-app="ChartApp">
    <head>
        <title>Essential Studio for AngularJS: Chart</title>
        <!--CSS and Script file References -->
    </head>
    <body ng-controller="ChartCtrl">
        <div id="container" ej-chart >
        <e-series>
        <e-series e-enableanimation="true" e-animationduration="2000"></e-series>
        </e-series>
        </div>
        <script>
        angular.module('ChartApp', ['ejangular'])
        .controller('ChartCtrl', function ($scope) {
                     });
        </script>
    </body>
</html>