Empty Points
17 Dec 20185 minutes to read
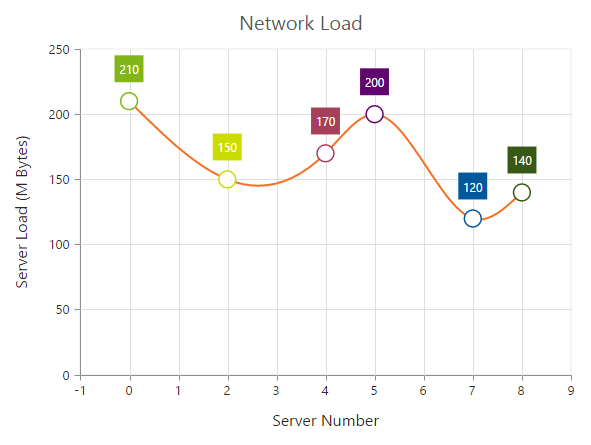
The Data points that uses the null or undefined as value are considered as empty points. Empty data points are ignored and not plotted in the Chart. When the data is provided by using the e-points property, you can set the isEmpty to true to specify that the particular point is an empty point.
<html xmlns="http://www.w3.org/1999/xhtml" lang="en" ng-app="ChartApp">
    <head>
        <title>Essential Studio for AngularJS: Chart</title>
        <!--CSS and Script file References -->
    </head>
    <body ng-controller="ChartCtrl">
        <div id="container" ej-chart >
        <e-series>
        <e-series >
        <e-points>
        <e-points e-x="0" e-y="210"></e-points>
        <e-points e-x="1" e-y="null"></e-points>
        <e-points e-x="2" e-y="150"></e-points>
        <e-points e-x="3" e-y="180" e-isempty="true"></e-points>
        <e-points e-x="4" e-y="170"></e-points>
        <e-points e-x="5" e-y="200"></e-points>
        <e-points e-x="6" e-y="140" e-isempty="true"></e-points>
        <e-points e-x="7" e-y="120"></e-points>
        <e-points e-x="8" e-y="140"></e-points>
        </e-points>
        </e-series>
        </e-series>
        </div>
        <script>
        angular.module('ChartApp', ['ejangular'])
        .controller('ChartCtrl', function ($scope) {
                   });
        </script>
    </body>
</html>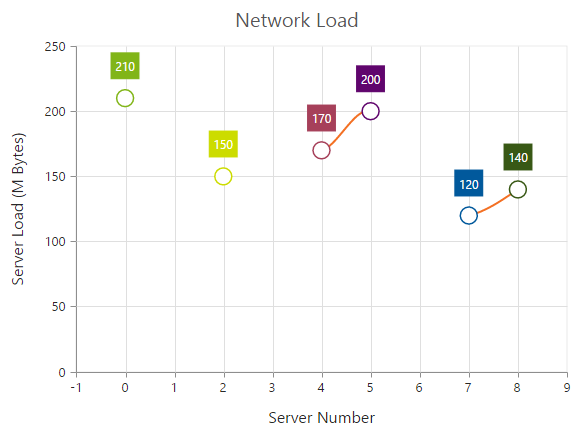
EmptyPointSettings
You can customize the empty points visibility and change its displayMode (gap, zero and average) using e-emptypointsettings option.
<html xmlns="http://www.w3.org/1999/xhtml" lang="en" ng-app="ChartApp">
    <head>
        <title>Essential Studio for AngularJS: Chart</title>
        <!--CSS and Script file References -->
    </head>
    <body ng-controller="ChartCtrl">
        <div id="container" ej-chart>
        <e-series>
        <e-series e-emptypointsettings-visible="true"
        e-emptypointsettings-displayMode="average"></e-series>
        </e-series>
        </div>
        <script>
        angular.module('ChartApp', ['ejangular'])
        .controller('ChartCtrl', function ($scope) {
                     });
        </script>
    </body>
</html>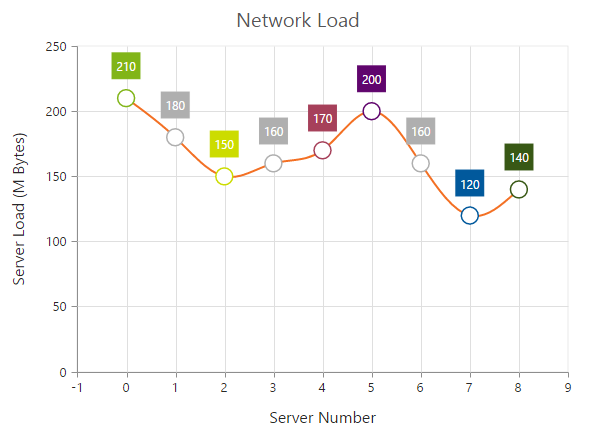
If the visible property of e-emptypointsettings is false, then the empty points has been dropped and chart will be rendered without empty points.
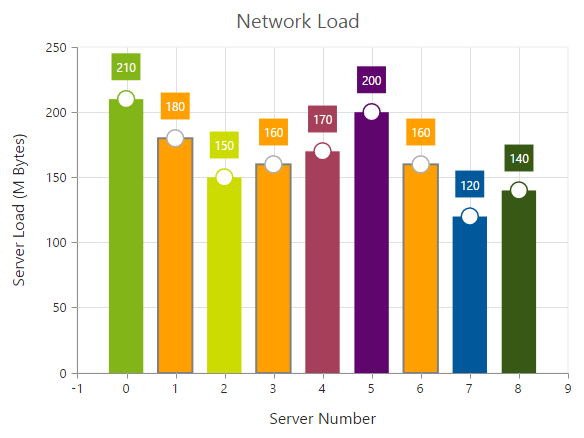
Customizing Styles
Empty points color and border can be customized using style property of e-emptypointsettings.
<html xmlns="http://www.w3.org/1999/xhtml" lang="en" ng-app="ChartApp">
    <head>
        <title>Essential Studio for AngularJS: Chart</title>
        <!--CSS and Script file References -->
    </head>
    <body ng-controller="ChartCtrl">
        <div id="container" ej-chart>
        <e-series>
        <e-series e-emptypointsettings-visible="true"
        e-emptypointsettings-style-color="#ffa000"
        e-emptypointsettings-style-border-color="gray"
        e-emptypointsettings-style-border-width="2"></e-series>
        </e-series>
        </div>
        <script>
        angular.module('ChartApp', ['ejangular'])
        .controller('ChartCtrl', function ($scope) {
                     });
        </script>
    </body>
</html>