Labels in .NET MAUI DateTime Range Selector (SfDateTimeRangeSelector)
8 Jan 202619 minutes to read
This section explains how to add the labels in the DateTime Range Selector.
Show labels
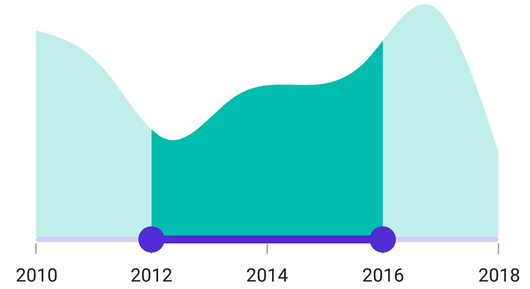
The ShowLabels property is used to render the labels at a given interval. The default value of the ShowLabels property is False.
<ContentPage
             ...
             xmlns:sliders="clr-namespace:Syncfusion.Maui.Sliders;assembly=Syncfusion.Maui.Sliders"
             xmlns:charts="clr-namespace:Syncfusion.Maui.Charts;assembly=Syncfusion.Maui.Charts">

    <sliders:SfDateTimeRangeSelector Minimum="2010-01-01"
                                     Maximum="2018-01-01"
                                     RangeStart="2012-01-01"
                                     RangeEnd="2016-01-01"
                                     Interval="2"
                                     ShowLabels="True"
                                     ShowTicks="True">

        <charts:SfCartesianChart>
            ...
        </charts:SfCartesianChart>

    </sliders:SfDateTimeRangeSelector>
</ContentPage>
SfDateTimeRangeSelector rangeSelector = new SfDateTimeRangeSelector();
rangeSelector.Minimum = new DateTime(2010, 01, 01);
rangeSelector.Maximum = new DateTime(2018, 01, 01);
rangeSelector.RangeStart = new DateTime(2012, 01, 01);
rangeSelector.RangeEnd = new DateTime(2016, 01, 01);
rangeSelector.Interval = 2;
rangeSelector.ShowLabels = true;
rangeSelector.ShowTicks = true;
SfCartesianChart chart = new SfCartesianChart();
rangeSelector.Content = chart;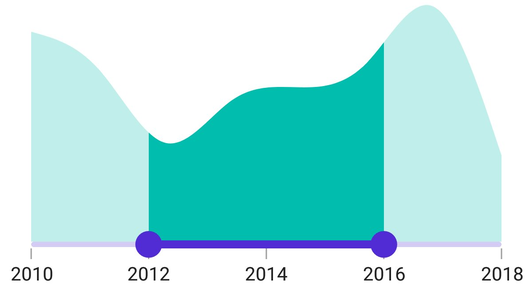
Date format
The DateFormat property is used to format the date labels. The default value of the DateFormat property is string.Empty.
<ContentPage
             ...
             xmlns:sliders="clr-namespace:Syncfusion.Maui.Sliders;assembly=Syncfusion.Maui.Sliders"
             xmlns:charts="clr-namespace:Syncfusion.Maui.Charts;assembly=Syncfusion.Maui.Charts">

    <sliders:SfDateTimeRangeSelector Minimum="2000-01-01T09:00:00"
                                     Maximum="2000-01-01T17:00:00"
                                     RangeStart="2000-01-01T11:00:00"
                                     RangeEnd="2000-01-01T15:00:00"
                                     ShowLabels="True"
                                     ShowTicks="True"
                                     IntervalType="Hours"
                                     Interval="2"
                                     DateFormat="h tt">

        <charts:SfCartesianChart>
            ...
        </charts:SfCartesianChart>

    </sliders:SfDateTimeRangeSelector>
</ContentPage>
SfDateTimeRangeSelector rangeSelector = new SfDateTimeRangeSelector();
rangeSelector.Minimum = new DateTime(2000, 01, 01, 09, 00, 00);
rangeSelector.Maximum = new DateTime(2000, 01, 01, 17, 00, 00);
rangeSelector.RangeStart = new DateTime(2000, 01, 01, 11, 00, 00);
rangeSelector.RangeEnd = new DateTime(2000, 01, 01, 15, 00, 00);
rangeSelector.Interval = 2;
rangeSelector.IntervalType = SliderDateIntervalType.Hours;
rangeSelector.DateFormat = "h tt";
rangeSelector.ShowLabels = true;
rangeSelector.ShowTicks = true;
SfCartesianChart chart = new SfCartesianChart();
rangeSelector.Content = chart;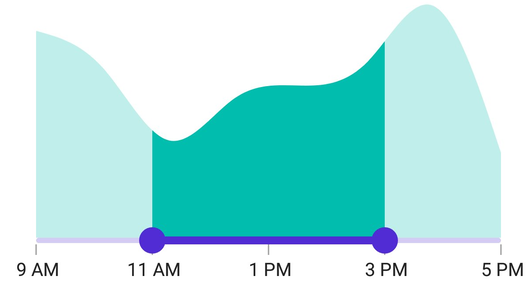
Label placement
The LabelsPlacement property is used to place the labels either between the major ticks or on the major ticks. The default value of the LabelsPlacement property is SliderLabelsPlacement.OnTicks.
<ContentPage
             ...
             xmlns:sliders="clr-namespace:Syncfusion.Maui.Sliders;assembly=Syncfusion.Maui.Sliders"
             xmlns:charts="clr-namespace:Syncfusion.Maui.Charts;assembly=Syncfusion.Maui.Charts">

    <sliders:SfDateTimeRangeSelector Minimum="2011-01-01"
                                     Maximum="2016-01-01"
                                     RangeStart="2012-01-01"
                                     RangeEnd="2015-01-01"
                                     Interval="1"
                                     LabelsPlacement="BetweenTicks"
                                     ShowLabels="True"
                                     ShowTicks="True">

        <charts:SfCartesianChart>
            ...
        </charts:SfCartesianChart>

    </sliders:SfDateTimeRangeSelector>
</ContentPage>
SfDateTimeRangeSelector rangeSelector = new SfDateTimeRangeSelector();
rangeSelector.Minimum = new DateTime(2011, 01, 01);
rangeSelector.Maximum = new DateTime(2016, 01, 01);
rangeSelector.RangeStart = new DateTime(2012, 01, 01);
rangeSelector.RangeEnd = new DateTime(2015, 01, 01);
rangeSelector.Interval = 1;
rangeSelector.LabelsPlacement = SliderLabelsPlacement.BetweenTicks;
rangeSelector.ShowLabels = true;
rangeSelector.ShowTicks = true;
SfCartesianChart chart = new SfCartesianChart();
rangeSelector.Content = chart;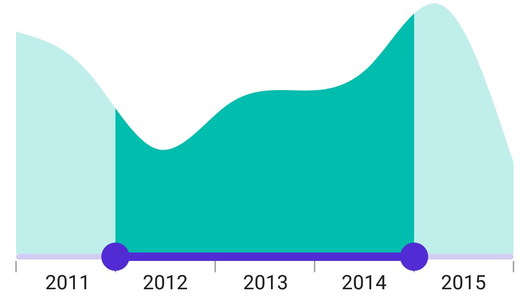
NOTE
Refer here to customize the label text format through range slider events.
Edge labels placement
The EdgeLabelsPlacement property is used to move the first and the last label either inside the track bounds or based on the intervals. The default value of the EdgeLabelsPlacement property is SliderEdgeLabelPlacement.Default.
If the TrackExtent > 0 and the EdgeLabelsPlacement is SliderEdgeLabelsPlacement.Inside, the labels get placed inside the extended track edges.
<ContentPage
             ...
             xmlns:sliders="clr-namespace:Syncfusion.Maui.Sliders;assembly=Syncfusion.Maui.Sliders"
             xmlns:charts="clr-namespace:Syncfusion.Maui.Charts;assembly=Syncfusion.Maui.Charts">

    <sliders:SfDateTimeRangeSelector Minimum="2002-01-07"
                                     Maximum="2002-01-13"
                                     RangeStart="2002-01-09"
                                     RangeEnd="2002-01-11"
                                     Interval="1"
                                     IntervalType="Days"
                                     DateFormat="ddd"
                                     EdgeLabelsPlacement="Inside"
                                     ShowLabels="True"
                                     ShowTicks="True">

        <charts:SfCartesianChart>
            ...
        </charts:SfCartesianChart>

    </sliders:SfDateTimeRangeSelector>
</ContentPage>
SfDateTimeRangeSelector rangeSelector = new SfDateTimeRangeSelector();
rangeSelector.Minimum = new DateTime(2002, 01, 07);
rangeSelector.Maximum = new DateTime(2002, 01, 13);
rangeSelector.RangeStart = new DateTime(2002, 01, 09);
rangeSelector.RangeEnd = new DateTime(2002, 01, 11);
rangeSelector.Interval = 1;
rangeSelector.IntervalType = SliderDateIntervalType.Days;
rangeSelector.DateFormat = "ddd";
rangeSelector.EdgeLabelsPlacement = SliderEdgeLabelsPlacement.Inside;
rangeSelector.ShowLabels = true;
rangeSelector.ShowTicks = true;
SfCartesianChart chart = new SfCartesianChart();
rangeSelector.Content = chart;
Label style
Change the active and inactive label appearance using the ActiveTextColor, ActiveFontSize, ActiveFontFamily, ActiveFontAttributes, InactiveTextColor, InactiveFontSize, InactiveFontFamily, InactiveFontAttributes, and Offset properties of the LabelStyle class.
The active side of the DateTime Range Selector is between the start and end thumbs.
The inactive side of the DateTime Range Selector is between the Minimum value and the left thumb and the right thumb and the Maximum value.
<ContentPage
             ...
             xmlns:sliders="clr-namespace:Syncfusion.Maui.Sliders;assembly=Syncfusion.Maui.Sliders"
             xmlns:charts="clr-namespace:Syncfusion.Maui.Charts;assembly=Syncfusion.Maui.Charts">

    <sliders:SfDateTimeRangeSelector Minimum="2010-01-01"
                                     Maximum="2018-01-01"
                                     RangeStart="2012-01-01"
                                     RangeEnd="2016-01-01"
                                     Interval="2"
                                     ShowLabels="True"
                                     ShowTicks="True">

        <sliders:SfDateTimeRangeSelector.LabelStyle>
            <sliders:SliderLabelStyle ActiveTextColor="#EE3F3F"
                                      InactiveTextColor="#F7B1AE"
                                      ActiveFontAttributes="Italic"
                                      InactiveFontAttributes="Bold"
                                      ActiveFontSize="16"
                                      InactiveFontSize="16" />
        </sliders:SfDateTimeRangeSelector.LabelStyle>

        <charts:SfCartesianChart>
            ...
        </charts:SfCartesianChart>

    </sliders:SfDateTimeRangeSelector>
</ContentPage>
SfDateTimeRangeSelector rangeSelector = new SfDateTimeRangeSelector();
rangeSelector.Minimum = new DateTime(2010, 01, 01);
rangeSelector.Maximum = new DateTime(2018, 01, 01);
rangeSelector.RangeStart = new DateTime(2012, 01, 01);
rangeSelector.RangeEnd = new DateTime(2016, 01, 01);
rangeSelector.Interval = 2;
rangeSelector.ShowLabels = true;
rangeSelector.ShowTicks = true;
rangeSelector.LabelStyle.ActiveTextColor = Color.FromArgb("#EE3F3F");
rangeSelector.LabelStyle.InactiveTextColor = Color.FromArgb("#F7B1AE");
rangeSelector.LabelStyle.ActiveFontSize = 16;
rangeSelector.LabelStyle.InactiveFontSize = 16;
rangeSelector.LabelStyle.ActiveFontAttributes = FontAttributes.Italic;
rangeSelector.LabelStyle.InactiveFontAttributes = FontAttributes.Bold;
SfCartesianChart chart = new SfCartesianChart();
rangeSelector.Content = chart;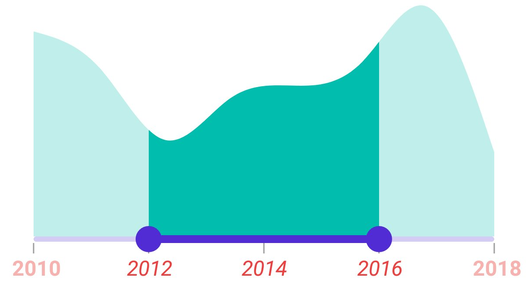
Label offset
Adjust the space between ticks and labels using the Offset property. The default value of the Offset property is 5.0 when the ShowTicks is enabled. Otherwise, it is 15.0 by default.
<ContentPage
             ...
             xmlns:sliders="clr-namespace:Syncfusion.Maui.Sliders;assembly=Syncfusion.Maui.Sliders"
             xmlns:charts="clr-namespace:Syncfusion.Maui.Charts;assembly=Syncfusion.Maui.Charts">

    <sliders:SfDateTimeRangeSelector Minimum="2010-01-01"
                                     Maximum="2018-01-01"
                                     RangeStart="2012-01-01"
                                     RangeEnd="2016-01-01"
                                     Interval="2"
                                     ShowLabels="True"
                                     ShowTicks="True">

        <sliders:SfDateTimeRangeSelector.LabelStyle>
            <sliders:SliderLabelStyle Offset="10" />
        </sliders:SfDateTimeRangeSelector.LabelStyle>

        <charts:SfCartesianChart>
            ...
        </charts:SfCartesianChart>

    </sliders:SfDateTimeRangeSelector>
</ContentPage>
SfDateTimeRangeSelector rangeSelector = new SfDateTimeRangeSelector();
rangeSelector.Minimum = new DateTime(2010, 01, 01);
rangeSelector.Maximum = new DateTime(2018, 01, 01);
rangeSelector.RangeStart = new DateTime(2012, 01, 01);
rangeSelector.RangeEnd = new DateTime(2016, 01, 01);
rangeSelector.Interval = 2;
rangeSelector.ShowLabels = true;
rangeSelector.ShowTicks = true;
rangeSelector.LabelStyle.Offset = 10;
SfCartesianChart chart = new SfCartesianChart();
rangeSelector.Content = chart;