Getting Started with .NET MAUI DateTime Range Selector
7 Feb 202524 minutes to read
This section guides you through setting up and configuring a DateTime Range Selector in your .NET MAUI application. Follow the steps below to add a basic DateTime Range Selector to your project.
To quickly get started with the .NET MAUI DateTime Range Selector, watch this video.
Prerequisites
Before proceeding, ensure the following are in place:
- Install .NET 8 SDK or later.
- Set up a .NET MAUI environment with Visual Studio 2022 (v17.8 or later).
Step 1: Create a New MAUI Project
- Go to File > New > Project and choose the .NET MAUI App template.
- Name the project and choose a location. Then, click Next.
- Select the .NET framework version and click Create.
Step 2: Install the Syncfusion® MAUI Sliders NuGet Package
- In Solution Explorer, right-click the project and choose Manage NuGet Packages.
- Search for Syncfusion.Maui.Sliders and install the latest version.
- Ensure the necessary dependencies are installed correctly, and the project is restored.
Step 3: Register the Handler
Syncfusion.Maui.Core nuget is a dependent package for all Syncfusion® controls of .NET MAUI. In the MauiProgram.cs file, register the handler for Syncfusion® core.
using Microsoft.Maui;
using Microsoft.Maui.Hosting;
using Microsoft.Maui.Controls.Compatibility;
using Microsoft.Maui.Controls.Hosting;
using Microsoft.Maui.Controls.Xaml;
using Syncfusion.Maui.Core.Hosting;

namespace RangeSelector
{
    public static class MauiProgram
    {
        public static MauiApp CreateMauiApp()
        {
            var builder = MauiApp.CreateBuilder();
            builder
            .UseMauiApp<App>()
            .ConfigureSyncfusionCore()
            .ConfigureFonts(fonts =>
            {
                fonts.AddFont("OpenSans-Regular.ttf", "OpenSansRegular");
            });

            return builder.Build();
        }
    }
}
Step 4: Add a Basic DateTime Range Selector
Import the SfDateTimeRangeSelector namespace and initialize the DateTime Range Selector as follows.
<ContentPage
    . . .
    xmlns:sliders="clr-namespace:Syncfusion.Maui.Sliders;assembly=Syncfusion.Maui.Sliders">
    <sliders:SfDateTimeRangeSelector Minimum="2010-01-01"
                                     Maximum="2018-01-01"
                                     RangeStart="2012-01-01"
                                     RangeEnd="2016-01-01" />
</ContentPage>
using Syncfusion.Maui.Sliders;
namespace GettingStarted
{
public partial class MainPage : ContentPage
{
public MainPage()
{
InitializeComponent();
SfDateTimeRangeSelector rangeSelector = new SfDateTimeRangeSelector();
rangeSelector.Minimum = new DateTime(2010, 01, 01);
rangeSelector.Maximum = new DateTime(2018, 01, 01);
rangeSelector.RangeStart = new DateTime(2012, 01, 01);
rangeSelector.RangeEnd = new DateTime(2016, 01, 01);
content = rangeSelector;
}
}
}Prerequisites
Before proceeding, ensure the following are set up:
- Install .NET 8 SDK or later is installed.
- Set up a .NET MAUI environment with Visual Studio Code.
- Ensure that the .NET MAUI extension is installed and configured as described here.
Step 1: Create a New .NET MAUI Project
- Open the Command Palette by pressing Ctrl+Shift+P and type .NET:New Project and press Enter.
- Choose the .NET MAUI App template.
- Select the project location, type the project name and press Enter.
- Then choose Create project
Step 2: Install the Syncfusion® MAUI Sliders NuGet Package
- Press Ctrl + ` (backtick) to open the integrated terminal in Visual Studio Code.
- Ensure you’re in the project root directory where your .csproj file is located.
- Run the command
dotnet add package Syncfusion.Maui.Slidersto install the Syncfusion® .NET MAUI Sliders package. - To ensure all dependencies are installed, run
dotnet restore.
Step 3: Register the Handler
Syncfusion.Maui.Core nuget is a dependent package for all Syncfusion® controls of .NET MAUI. In the MauiProgram.cs file, register the handler for Syncfusion® core.
using Microsoft.Maui;
using Microsoft.Maui.Hosting;
using Microsoft.Maui.Controls.Compatibility;
using Microsoft.Maui.Controls.Hosting;
using Microsoft.Maui.Controls.Xaml;
using Syncfusion.Maui.Core.Hosting;

namespace RangeSelector
{
    public static class MauiProgram
    {
        public static MauiApp CreateMauiApp()
        {
            var builder = MauiApp.CreateBuilder();
            builder
            .UseMauiApp<App>()
            .ConfigureSyncfusionCore()
            .ConfigureFonts(fonts =>
            {
                fonts.AddFont("OpenSans-Regular.ttf", "OpenSansRegular");
            });

            return builder.Build();
        }
    }
}
Step 4: Add a Basic DateTime Range Selector
Import the SfDateTimeRangeSelector namespace and initialize the DateTime Range Selector as follows.
<ContentPage
    . . .
    xmlns:sliders="clr-namespace:Syncfusion.Maui.Sliders;assembly=Syncfusion.Maui.Sliders">
    <sliders:SfDateTimeRangeSelector Minimum="2010-01-01"
                                     Maximum="2018-01-01"
                                     RangeStart="2012-01-01"
                                     RangeEnd="2016-01-01" />
</ContentPage>
using Syncfusion.Maui.Sliders;
namespace GettingStarted
{
public partial class MainPage : ContentPage
{
public MainPage()
{
InitializeComponent();
SfDateTimeRangeSelector rangeSelector = new SfDateTimeRangeSelector();
rangeSelector.Minimum = new DateTime(2010, 01, 01);
rangeSelector.Maximum = new DateTime(2018, 01, 01);
rangeSelector.RangeStart = new DateTime(2012, 01, 01);
rangeSelector.RangeEnd = new DateTime(2016, 01, 01);
content = rangeSelector;
}
}
}Prerequisites
Before proceeding, ensure the following are set up:
- Ensure you have the latest version of JetBrains Rider.
- Install .NET 8 SDK or later is installed.
- Make sure the MAUI workloads are installed and configured as described here.
Step 1: Create a new .NET MAUI Project
- Go to File > New Solution, Select .NET (C#) and choose the .NET MAUI App template.
- Enter the Project Name, Solution Name, and Location.
- Select the .NET framework version and click Create.
Step 2: Install the Syncfusion® MAUI Sliders NuGet Package
- In Solution Explorer, right-click the project and choose Manage NuGet Packages.
- Search for Syncfusion.Maui.Sliders and install the latest version.
- Ensure the necessary dependencies are installed correctly, and the project is restored. If not, Open the Terminal in Rider and manually run:
dotnet restore
Step 3: Register the Handler
Syncfusion.Maui.Core nuget is a dependent package for all Syncfusion® controls of .NET MAUI. In the MauiProgram.cs file, register the handler for Syncfusion® core.
using Microsoft.Maui;
using Microsoft.Maui.Hosting;
using Microsoft.Maui.Controls.Compatibility;
using Microsoft.Maui.Controls.Hosting;
using Microsoft.Maui.Controls.Xaml;
using Syncfusion.Maui.Core.Hosting;

namespace RangeSelector
{
    public static class MauiProgram
    {
        public static MauiApp CreateMauiApp()
        {
            var builder = MauiApp.CreateBuilder();
            builder
            .UseMauiApp<App>()
            .ConfigureSyncfusionCore()
            .ConfigureFonts(fonts =>
            {
                fonts.AddFont("OpenSans-Regular.ttf", "OpenSansRegular");
            });

            return builder.Build();
        }
    }
}
Step 4: Add a Basic DateTime Range Selector
Import the SfDateTimeRangeSelector namespace and initialize the DateTime Range Selector as follows.
<ContentPage
    . . .
    xmlns:sliders="clr-namespace:Syncfusion.Maui.Sliders;assembly=Syncfusion.Maui.Sliders">
    <sliders:SfDateTimeRangeSelector Minimum="2010-01-01"
                                     Maximum="2018-01-01"
                                     RangeStart="2012-01-01"
                                     RangeEnd="2016-01-01" />
</ContentPage>
using Syncfusion.Maui.Sliders;
namespace GettingStarted
{
public partial class MainPage : ContentPage
{
public MainPage()
{
InitializeComponent();
SfDateTimeRangeSelector rangeSelector = new SfDateTimeRangeSelector();
rangeSelector.Minimum = new DateTime(2010, 01, 01);
rangeSelector.Maximum = new DateTime(2018, 01, 01);
rangeSelector.RangeStart = new DateTime(2012, 01, 01);
rangeSelector.RangeEnd = new DateTime(2016, 01, 01);
content = rangeSelector;
}
}
}
Adding content to the DateTime Range Selector
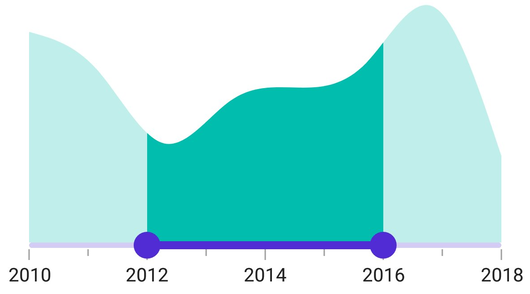
The Content property will add the content to the DateTime Range Selector. Add any control within the DateTime Range Selector with this property. In most cases, the Charts will be added as a content.
<ContentPage
             ...
             xmlns:sliders="clr-namespace:Syncfusion.Maui.Sliders;assembly=Syncfusion.Maui.Sliders"
             xmlns:charts="clr-namespace:Syncfusion.Maui.Charts;assembly=Syncfusion.Maui.Charts"
             xmlns:local="clr-namespace:SliderTestbedSample.RangeSelector">

    <ContentPage.BindingContext>
        <local:ViewModel />
    </ContentPage.BindingContext>

    <sliders:SfDateTimeRangeSelector Minimum="2010-01-01"
                                     Maximum="2018-01-01"
                                     RangeStart="2012-01-01"
                                     RangeEnd="2016-01-01">
        <charts:SfCartesianChart>

            <charts:SfCartesianChart.XAxes>
                <charts:DateTimeAxis IsVisible="False"
                                    ShowMajorGridLines="False" />
            </charts:SfCartesianChart.XAxes>

            <charts:SfCartesianChart.YAxes>
                <charts:NumericalAxis IsVisible="False"
                                     ShowMajorGridLines="False" />
            </charts:SfCartesianChart.YAxes>

            <charts:SfCartesianChart.Series>
                <charts:SplineAreaSeries ItemsSource="{Binding Source}"
                                        XBindingPath="X"
                                        YBindingPath="Y">
                </charts:SplineAreaSeries>

            </charts:SfCartesianChart.Series>

        </charts:SfCartesianChart>

    </sliders:SfDateTimeRangeSelector>
</ContentPage>
SfCartesianChart chart = new SfCartesianChart();
DateTimeAxis primaryAxis = new DateTimeAxis();
chart.XAxes.Add(primaryAxis);
NumericalAxis secondaryAxis = new NumericalAxis();
chart.YAxes.Add(secondaryAxis);
SplineAreaSeries series = new SplineAreaSeries()
{
ItemsSource = new ViewModel().Source,
XBindingPath = "X",
YBindingPath = "Y",
};
chart.Series.Add(series);
SfDateTimeRangeSelector rangeSelector = new SfDateTimeRangeSelector()
{
Minimum = new DateTime(2010, 01, 01),
Maximum = new DateTime(2018, 01, 01),
RangeStart = new DateTime(2012, 01, 01),
RangeEnd = new DateTime(2016, 01, 01),
Content = chart,
};
this.Content = rangeSelector;
Enable labels
The ShowLabels property enables the labels which render on a given interval.
<ContentPage
             ...
             xmlns:sliders="clr-namespace:Syncfusion.Maui.Sliders;assembly=Syncfusion.Maui.Sliders"
             xmlns:charts="clr-namespace:Syncfusion.Maui.Charts;assembly=Syncfusion.Maui.Charts">

    <sliders:SfDateTimeRangeSelector Minimum="2010-01-01"
                                     Maximum="2018-01-01"
                                     RangeStart="2012-01-01"
                                     RangeEnd="2016-01-01"
                                     Interval="2"
                                     ShowLabels="True">

        <charts:SfCartesianChart>
            ...
        </charts:SfCartesianChart>

    </sliders:SfDateTimeRangeSelector>
</ContentPage>
SfDateTimeRangeSelector rangeSelector = new SfDateTimeRangeSelector();
rangeSelector.Minimum = new DateTime(2010, 01, 01);
rangeSelector.Maximum = new DateTime(2018, 01, 01);
rangeSelector.RangeStart = new DateTime(2012, 01, 01);
rangeSelector.RangeEnd = new DateTime(2016, 01, 01);
rangeSelector.Interval = 2;
rangeSelector.ShowLabel = true;
SfCartesianChart chart = new SfCartesianChart();
rangeSelector.Content = chart;
Enable ticks
The ShowTicks property enables the ticks in the DateTime Range Selector while the MinorTicksPerInterval property enables the minor ticks between the major ticks.
<ContentPage
             ...
             xmlns:sliders="clr-namespace:Syncfusion.Maui.Sliders;assembly=Syncfusion.Maui.Sliders"
             xmlns:charts="clr-namespace:Syncfusion.Maui.Charts;assembly=Syncfusion.Maui.Charts">

    <sliders:SfDateTimeRangeSelector Minimum="2010-01-01"
                                     Maximum="2018-01-01"
                                     RangeStart="2012-01-01"
                                     RangeEnd="2016-01-01"
                                     Interval="2"
                                     ShowLabels="True"
                                     ShowTicks="True"
                                     MinorTicksPerInterval="1">

        <charts:SfCartesianChart>
            ...
        </charts:SfCartesianChart>

    </sliders:SfDateTimeRangeSelector>
</ContentPage>
SfDateTimeRangeSelector rangeSelector = new SfDateTimeRangeSelector();
rangeSelector.Minimum = new DateTime(2010, 01, 01);
rangeSelector.Maximum = new DateTime(2018, 01, 01);
rangeSelector.RangeStart = new DateTime(2012, 01, 01);
rangeSelector.RangeEnd = new DateTime(2016, 01, 01);
rangeSelector.Interval = 2;
rangeSelector.ShowLabels = true;
rangeSelector.ShowTicks = true;
rangeSelector.MinorTicksPerInterval = 1;
SfCartesianChart chart = new SfCartesianChart();
rangeSelector.Content = chart;
Inverse the Range Selector
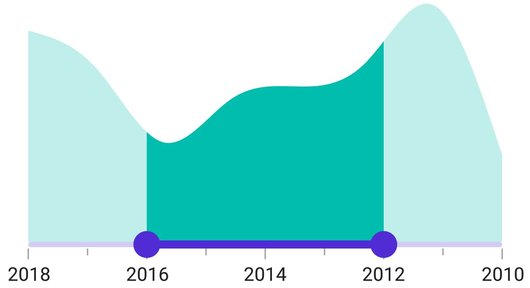
Invert the DateTime Range Selector using the IsInversed property. The default value of the IsInversed property is False.
<ContentPage
             ...
             xmlns:sliders="clr-namespace:Syncfusion.Maui.Sliders;assembly=Syncfusion.Maui.Sliders"
             xmlns:charts="clr-namespace:Syncfusion.Maui.Charts;assembly=Syncfusion.Maui.Charts">

    <sliders:SfDateTimeRangeSelector Minimum="2010-01-01"
                                     Maximum="2018-01-01"
                                     RangeStart="2012-01-01"
                                     RangeEnd="2016-01-01"
                                     Interval="2"
                                     ShowLabels="True"
                                     ShowTicks="True"
                                     MinorTicksPerInterval="1"
                                     IsInversed="True">

        <charts:SfCartesianChart>
            ...
        </charts:SfCartesianChart>

    </sliders:SfDateTimeRangeSelector>
</ContentPage>
SfDateTimeRangeSelector rangeSelector = new SfDateTimeRangeSelector();
rangeSelector.Minimum = new DateTime(2010, 01, 01);
rangeSelector.Maximum = new DateTime(2018, 01, 01);
rangeSelector.RangeStart = new DateTime(2012, 01, 01);
rangeSelector.RangeEnd = new DateTime(2016, 01, 01);
rangeSelector.Interval = 2;
rangeSelector.ShowLabels = true;
rangeSelector.ShowTicks = true;
rangeSelector.MinorTicksPerInterval = 1;
rangeSelector.IsInversed = true;
SfCartesianChart chart = new SfCartesianChart();
rangeSelector.Content = chart;
Formatting labels
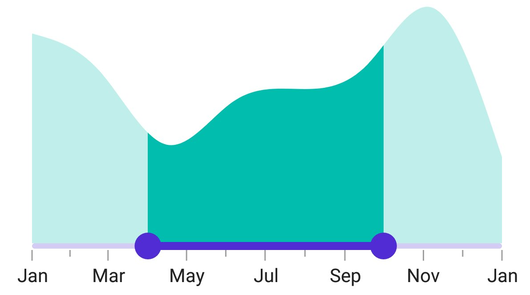
Add prefix or suffix to the labels using the DateFormat property.
<ContentPage
             ...
             xmlns:sliders="clr-namespace:Syncfusion.Maui.Sliders;assembly=Syncfusion.Maui.Sliders"
             xmlns:charts="clr-namespace:Syncfusion.Maui.Charts;assembly=Syncfusion.Maui.Charts">

    <sliders:SfDateTimeRangeSelector Minimum="2010-01-01"
                                     Maximum="2011-01-01"
                                     RangeStart="2010-04-01"
                                     RangeEnd="2010-10-01"
                                     DateFormat="MMM"
                                     IntervalType="Months"
                                     ShowTicks="True"
                                     MinorTicksPerInterval="1"
                                     ShowLabels="True"
                                     Interval="2">

        <charts:SfCartesianChart>
            ...
        </charts:SfCartesianChart>

    </sliders:SfDateTimeRangeSelector>
</ContentPage>
SfDateTimeRangeSelector rangeSelector = new SfDateTimeRangeSelector();
rangeSelector.Minimum = new DateTime(2010, 01, 01);
rangeSelector.Maximum = new DateTime(2011, 01, 01);
rangeSelector.RangeStart = new DateTime(2010, 04, 01);
rangeSelector.RangeEnd = new DateTime(2010, 10, 01);
rangeSelector.ShowLabels = true;
rangeSelector.Interval = 2;
rangeSelector.ShowTicks = true;
rangeSelector.MinorTicksPerInterval = 1;
rangeSelector.DateFormat = "MMM";
rangeSelector.IntervalType = SliderDateIntervalType.Months;
SfCartesianChart chart = new SfCartesianChart();
rangeSelector.Content = chart;