Tick in .NET MAUI DateTime Range Selector (SfDateTimeRangeSelector)
17 Jan 202523 minutes to read
This section helps to learn about how to add major and minor ticks in the DateTime Range Selector.
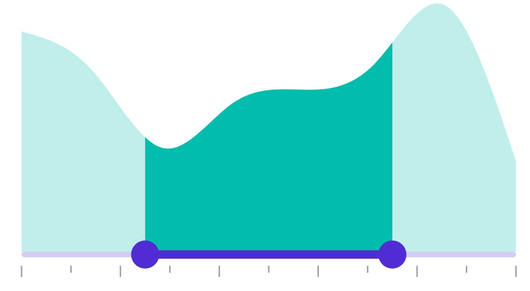
Show major ticks
Enable the major ticks on the track. It is a shape used to represent the major interval points of the track. The default value of the ShowTicks property is False.
For example, if the Minimum is 2010-01-01, the Maximum is 2018-01-01, and Interval is 2.0, the Range Selector will render the major ticks at 2010, 2012, 2014, and so on.
Without interval
<ContentPage
             ...
             xmlns:sliders="clr-namespace:Syncfusion.Maui.Sliders;assembly=Syncfusion.Maui.Sliders"
             xmlns:charts="clr-namespace:Syncfusion.Maui.Charts;assembly=Syncfusion.Maui.Charts">

    <sliders:SfDateTimeRangeSelector Minimum="2010-01-01"
                                     Maximum="2018-01-01"
                                     RangeStart="2012-01-01"
                                     RangeEnd="2016-01-01"
                                     ShowTicks="True">

        <charts:SfCartesianChart>
            ...
        </charts:SfCartesianChart>

    </sliders:SfDateTimeRangeSelector>
</ContentPage>
SfDateTimeRangeSelector rangeSelector = new SfDateTimeRangeSelector();
rangeSelector.Minimum = new DateTime(2010, 01, 01);
rangeSelector.Maximum = new DateTime(2018, 01, 01);
rangeSelector.RangeStart = new DateTime(2012, 01, 01);
rangeSelector.RangeEnd = new DateTime(2016, 01, 01);
rangeSelector.ShowTicks = true;
SfCartesianChart chart = new SfCartesianChart();
rangeSelector.Content = chart;
With interval
<ContentPage
             ...
             xmlns:sliders="clr-namespace:Syncfusion.Maui.Sliders;assembly=Syncfusion.Maui.Sliders"
             xmlns:charts="clr-namespace:Syncfusion.Maui.Charts;assembly=Syncfusion.Maui.Charts">

    <sliders:SfDateTimeRangeSelector Minimum="2010-01-01"
                                     Maximum="2018-01-01"
                                     RangeStart="2012-01-01"
                                     RangeEnd="2016-01-01"
                                     Interval="2"
                                     ShowTicks="True">

        <charts:SfCartesianChart>
            ...
        </charts:SfCartesianChart>

    </sliders:SfDateTimeRangeSelector>
</ContentPage>
SfDateTimeRangeSelector rangeSelector = new SfDateTimeRangeSelector();
rangeSelector.Minimum = new DateTime(2010, 01, 01);
rangeSelector.Maximum = new DateTime(2018, 01, 01);
rangeSelector.RangeStart = new DateTime(2012, 01, 01);
rangeSelector.RangeEnd = new DateTime(2016, 01, 01);
rangeSelector.Interval = 2;
rangeSelector.ShowTicks = true;
SfCartesianChart chart = new SfCartesianChart();
rangeSelector.Content = chart;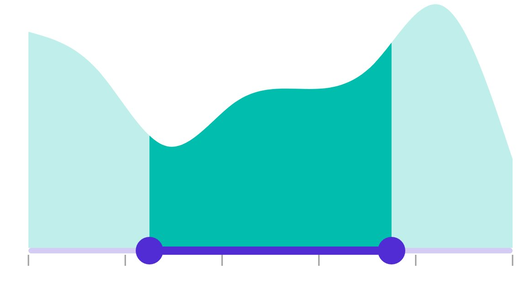
Show minor ticks
It represents the number of smaller ticks between two major ticks. For example, if the Minimum is DateTime(2010, 01, 01), the Maximum is DateTime(2018, 01, 01), and Interval is 2.0, the DateTime Range Selector will render the major ticks at 2010, 2012, 2014, and so on. If the MinorTicksPerInterval is 1, then smaller ticks will be rendered on 2010 and 2012 and so on. The default value of the MinorTicksPerInterval property is 0.
Without interval
<ContentPage
             ...
             xmlns:sliders="clr-namespace:Syncfusion.Maui.Sliders;assembly=Syncfusion.Maui.Sliders"
             xmlns:charts="clr-namespace:Syncfusion.Maui.Charts;assembly=Syncfusion.Maui.Charts">

    <sliders:SfDateTimeRangeSelector Minimum="2010-01-01"
                                     Maximum="2018-01-01"
                                     RangeStart="2012-01-01"
                                     RangeEnd="2016-01-01"
                                     ShowTicks="True"
                                     MinorTicksPerInterval="1">

        <charts:SfCartesianChart>
            ...
        </charts:SfCartesianChart>

    </sliders:SfDateTimeRangeSelector>
</ContentPage>
SfDateTimeRangeSelector rangeSelector = new SfDateTimeRangeSelector();
rangeSelector.Minimum = new DateTime(2010, 01, 01);
rangeSelector.Maximum = new DateTime(2018, 01, 01);
rangeSelector.RangeStart = new DateTime(2012, 01, 01);
rangeSelector.RangeEnd = new DateTime(2016, 01, 01);
rangeSelector.MinorTicksPerInterval = 1;
rangeSelector.ShowTicks = true;
SfCartesianChart chart = new SfCartesianChart();
rangeSelector.Content = chart;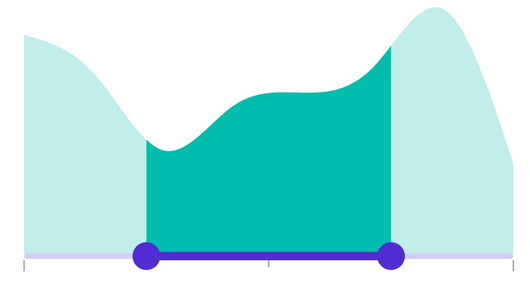
With interval
<ContentPage
             ...
             xmlns:sliders="clr-namespace:Syncfusion.Maui.Sliders;assembly=Syncfusion.Maui.Sliders"
             xmlns:charts="clr-namespace:Syncfusion.Maui.Charts;assembly=Syncfusion.Maui.Charts">

    <sliders:SfDateTimeRangeSelector Minimum="2010-01-01"
                                     Maximum="2018-01-01"
                                     RangeStart="2012-01-01"
                                     RangeEnd="2016-01-01"
                                     Interval="2"
                                     ShowTicks="True"
                                     MinorTicksPerInterval="1">

        <charts:SfCartesianChart>
            ...
        </charts:SfCartesianChart>

    </sliders:SfDateTimeRangeSelector>
</ContentPage>
SfDateTimeRangeSelector rangeSelector = new SfDateTimeRangeSelector();
rangeSelector.Minimum = new DateTime(2010, 01, 01);
rangeSelector.Maximum = new DateTime(2018, 01, 01);
rangeSelector.RangeStart = new DateTime(2012, 01, 01);
rangeSelector.RangeEnd = new DateTime(2016, 01, 01);
rangeSelector.Interval = 2;
rangeSelector.MinorTicksPerInterval = 1;
rangeSelector.ShowTicks = true;
SfCartesianChart chart = new SfCartesianChart();
rangeSelector.Content = chart;
Major ticks color
Change the color of the active and inactive major ticks using the ActiveFill and InactiveFill properties of the MajorTickStyle class.
The active side of the DateTime Range Selector is between the start and end thumbs.
The inactive side of the Range Selector is between the Minimum value and the left thumb, and the right thumb and the Maximum value.
<ContentPage
             ...
             xmlns:sliders="clr-namespace:Syncfusion.Maui.Sliders;assembly=Syncfusion.Maui.Sliders"
             xmlns:charts="clr-namespace:Syncfusion.Maui.Charts;assembly=Syncfusion.Maui.Charts">

    <sliders:SfDateTimeRangeSelector Minimum="2010-01-01"
                                     Maximum="2018-01-01"
                                     RangeStart="2012-01-01"
                                     RangeEnd="2016-01-01"
                                     Interval="2"
                                     ShowTicks="True">

        <sliders:SfDateTimeRangeSelector.MajorTickStyle>
            <sliders:SliderTickStyle ActiveFill="#EE3F3F"
                                     InactiveFill="#F7B1AE" />
        </sliders:SfDateTimeRangeSelector.MajorTickStyle>

        <charts:SfCartesianChart>
            ...
        </charts:SfCartesianChart>

    </sliders:SfDateTimeRangeSelector>
</ContentPage>
SfDateTimeRangeSelector rangeSelector = new SfDateTimeRangeSelector();
rangeSelector.Minimum = new DateTime(2010, 01, 01);
rangeSelector.Maximum = new DateTime(2018, 01, 01);
rangeSelector.RangeStart = new DateTime(2012, 01, 01);
rangeSelector.RangeEnd = new DateTime(2016, 01, 01);
rangeSelector.Interval = 2;
rangeSelector.ShowTicks = true;
rangeSelector.MajorTickStyle.ActiveFill = new SolidColorBrush(Color.FromArgb("#EE3F3F"));
rangeSelector.MajorTickStyle.InactiveFill = new SolidColorBrush(Color.FromArgb("#F7B1AE"));
SfCartesianChart chart = new SfCartesianChart();
rangeSelector.Content = chart;
Minor ticks color
Change the color of the active and inactive minor ticks using the ActiveFill and InactiveFill properties of the MinorTickStyle class.
The active side of the DateTime Range Selector is between the start and end thumbs.
The inactive side of the DateTime Range Selector is between the Minimum value and the left thumb, and the right thumb and the Maximum value.
<ContentPage
             ...
             xmlns:sliders="clr-namespace:Syncfusion.Maui.Sliders;assembly=Syncfusion.Maui.Sliders"
             xmlns:charts="clr-namespace:Syncfusion.Maui.Charts;assembly=Syncfusion.Maui.Charts">

    <sliders:SfDateTimeRangeSelector Minimum="2010-01-01"
                                     Maximum="2018-01-01"
                                     RangeStart="2012-01-01"
                                     RangeEnd="2016-01-01"
                                     Interval="0.2"
                                     ShowTicks="True"
                                     MinorTicksPerInterval="1">

        <sliders:SfDateTimeRangeSelector.MinorTickStyle>
            <sliders:SliderTickStyle ActiveFill="#EE3F3F"
                                     InactiveFill="#F7B1AE" />
        </sliders:SfDateTimeRangeSelector.MinorTickStyle>

        <charts:SfCartesianChart>
            ...
        </charts:SfCartesianChart>

    </sliders:SfDateTimeRangeSelector>
</ContentPage>
SfDateTimeRangeSelector rangeSelector = new SfDateTimeRangeSelector();
rangeSelector.Minimum = new DateTime(2010, 01, 01);
rangeSelector.Maximum = new DateTime(2018, 01, 01);
rangeSelector.RangeStart = new DateTime(2012, 01, 01);
rangeSelector.RangeEnd = new DateTime(2016, 01, 01);
rangeSelector.Interval = 2;
rangeSelector.ShowTicks = true;
rangeSelector.MinorTicksPerInterval = 1;
rangeSelector.MinorTickStyle.ActiveFill = new SolidColorBrush(Color.FromArgb("#EE3F3F"));
rangeSelector.MinorTickStyle.InactiveFill = new SolidColorBrush(Color.FromArgb("#F7B1AE"));
SfCartesianChart chart = new SfCartesianChart();
rangeSelector.Content = chart;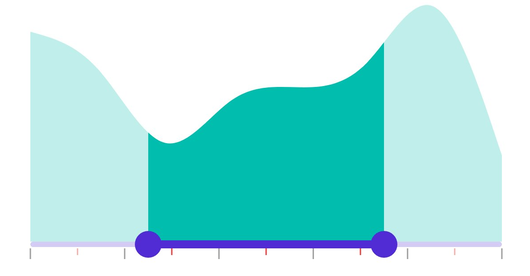
Ticks size
Change the major and minor ticks size using the ActiveSize and InactiveSize property of the MajorTickStyle and MinorTickStyle classes. The default value is Size(2.0, 8.0).
<ContentPage
             ...
             xmlns:sliders="clr-namespace:Syncfusion.Maui.Sliders;assembly=Syncfusion.Maui.Sliders"
             xmlns:charts="clr-namespace:Syncfusion.Maui.Charts;assembly=Syncfusion.Maui.Charts">

    <sliders:SfDateTimeRangeSelector Minimum="2010-01-01"
                                     Maximum="2018-01-01"
                                     RangeStart="2012-01-01"
                                     RangeEnd="2016-01-01"
                                     Interval="2"
                                     ShowTicks="True"
                                     MinorTicksPerInterval="1">

        <sliders:SfDateTimeRangeSelector.MinorTickStyle>
            <sliders:SliderTickStyle ActiveSize="2,10" InactiveSize="2, 10" />
        </sliders:SfDateTimeRangeSelector.MinorTickStyle>

        <sliders:SfDateTimeRangeSelector.MajorTickStyle>
            <sliders:SliderTickStyle ActiveSize="2,15" InactiveSize="2, 15" />
        </sliders:SfDateTimeRangeSelector.MajorTickStyle>

        <charts:SfCartesianChart>
            ...
        </charts:SfCartesianChart>

    </sliders:SfDateTimeRangeSelector>
</ContentPage>
SfDateTimeRangeSelector rangeSelector = new SfDateTimeRangeSelector();
rangeSelector.Minimum = new DateTime(2010, 01, 01);
rangeSelector.Maximum = new DateTime(2018, 01, 01);
rangeSelector.RangeStart = new DateTime(2012, 01, 01);
rangeSelector.RangeEnd = new DateTime(2016, 01, 01);
rangeSelector.Interval = 2;
rangeSelector.ShowTicks = true;
rangeSelector.MinorTicksPerInterval = 1;
rangeSelector.MinorTickStyle.ActiveSize = new Size(2, 10);
rangeSelector.MinorTickStyle.InactiveSize = new Size(2, 10);
rangeSelector.MajorTickStyle.ActiveSize = new Size(2, 15);
rangeSelector.MajorTickStyle.InactiveSize = new Size(2, 15);
SfCartesianChart chart = new SfCartesianChart();
rangeSelector.Content = chart;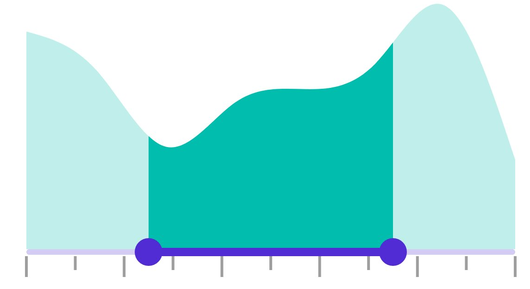
Ticks offset
Adjust the space between the track and ticks using the Offset property of the MajorTickStyle and MinorTickStyle. The default value of the Offset property is 3.0.
<ContentPage
             ...
             xmlns:sliders="clr-namespace:Syncfusion.Maui.Sliders;assembly=Syncfusion.Maui.Sliders"
             xmlns:charts="clr-namespace:Syncfusion.Maui.Charts;assembly=Syncfusion.Maui.Charts">

    <sliders:SfDateTimeRangeSelector Minimum="2010-01-01"
                                     Maximum="2018-01-01"
                                     RangeStart="2012-01-01"
                                     RangeEnd="2016-01-01"
                                     Interval="2"
                                     ShowTicks="True"
                                     MinorTicksPerInterval="1">

        <sliders:SfDateTimeRangeSelector.MinorTickStyle>
            <sliders:SliderTickStyle Offset="5" />
        </sliders:SfDateTimeRangeSelector.MinorTickStyle>

        <sliders:SfDateTimeRangeSelector.MajorTickStyle>
            <sliders:SliderTickStyle Offset="5" />
        </sliders:SfDateTimeRangeSelector.MajorTickStyle>

        <charts:SfCartesianChart>
            ...
        </charts:SfCartesianChart>

    </sliders:SfDateTimeRangeSelector>
</ContentPage>
SfDateTimeRangeSelector rangeSelector = new SfDateTimeRangeSelector();
rangeSelector.Minimum = new DateTime(2010, 01, 01);
rangeSelector.Maximum = new DateTime(2018, 01, 01);
rangeSelector.RangeStart = new DateTime(2012, 01, 01);
rangeSelector.RangeEnd = new DateTime(2016, 01, 01);
rangeSelector.Interval = 2;
rangeSelector.ShowTicks = true;
rangeSelector.MinorTicksPerInterval = 1;
rangeSelector.MinorTickStyle.Offset = 5;
rangeSelector.MajorTickStyle.Offset = 5;
SfCartesianChart chart = new SfCartesianChart();
rangeSelector.Content = chart;