Track in .NET MAUI DateTime Range Selector (SfDateTimeRangeSelector)
8 Jun 202613 minutes to read
This section helps to learn about how to customize the track in the DateTime Range Selector.
Minimum
The minimum value that the user can select. The default value of the Minimum property is null. The Minimum value must be less than the Maximum value.
Maximum
The maximum value that the user can select. The default value of the Maximum property is null. The Maximum value must be greater than the Minimum value.
Range values
It represents the values currently selected in the DateTime Range Selector. The thumb is drawn corresponding to this RangeStart and RangeEnd values.
<ContentPage
             ...
             xmlns:sliders="clr-namespace:Syncfusion.Maui.Sliders;assembly=Syncfusion.Maui.Sliders"
             xmlns:charts="clr-namespace:Syncfusion.Maui.Charts;assembly=Syncfusion.Maui.Charts">

    <sliders:SfDateTimeRangeSelector Minimum="2010-01-01"
                                     Maximum="2020-01-01"
                                     RangeStart="2012-01-01"
                                     RangeEnd="2018-01-01"
                                     ShowLabels="True">

        <charts:SfCartesianChart>
            ...
        </charts:SfCartesianChart>

    </sliders:SfDateTimeRangeSelector>
</ContentPage>
SfDateTimeRangeSelector rangeSelector = new SfDateTimeRangeSelector();
rangeSelector.Minimum = new DateTime(2010, 01, 01);
rangeSelector.Maximum = new DateTime(2020, 01, 01);
rangeSelector.RangeStart = new DateTime(2012, 01, 01);
rangeSelector.RangeEnd = new DateTime(2018, 01, 01);
rangeSelector.ShowLabels = true;
SfCartesianChart chart = new SfCartesianChart();
rangeSelector.Content = chart;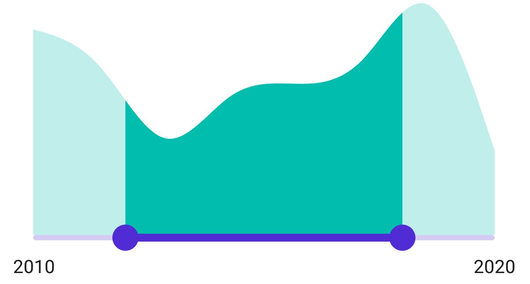
Track color
Change the active and inactive track colors using the ActiveFill and InactiveFill properties of the TrackStyle class.
The active side of the DateTime Range Selector is between the start and end thumbs.
The inactive side of the DateTime Range Selector is between the Minimum value and the left thumb and the right thumb and the Maximum value.
<ContentPage
             ...
             xmlns:sliders="clr-namespace:Syncfusion.Maui.Sliders;assembly=Syncfusion.Maui.Sliders"
             xmlns:charts="clr-namespace:Syncfusion.Maui.Charts;assembly=Syncfusion.Maui.Charts">

    <sliders:SfDateTimeRangeSelector Minimum="2010-01-01"
                                     Maximum="2018-01-01"
                                     RangeStart="2012-01-01"
                                     RangeEnd="2016-01-01">

        <sliders:SfDateTimeRangeSelector.TrackStyle>
            <sliders:SliderTrackStyle ActiveFill="#EE3F3F" InactiveFill="#F7B1AE" />
        </sliders:SfDateTimeRangeSelector.TrackStyle>

        <charts:SfCartesianChart>
            ...
        </charts:SfCartesianChart>

    </sliders:SfDateTimeRangeSelector>
</ContentPage>
SfDateTimeRangeSelector rangeSelector = new SfDateTimeRangeSelector();
rangeSelector.Minimum = new DateTime(2010, 01, 01);
rangeSelector.Maximum = new DateTime(2018, 01, 01);
rangeSelector.RangeStart = new DateTime(2012, 01, 01);
rangeSelector.RangeEnd = new DateTime(2016, 01, 01);
rangeSelector.TrackStyle.ActiveFill = new SolidColorBrush(Color.FromArgb("#EE3F3F"));
rangeSelector.TrackStyle.InactiveFill = new SolidColorBrush(Color.FromArgb("#F7B1AE"));
SfCartesianChart chart = new SfCartesianChart();
rangeSelector.Content = chart;
Track height
Change the active and inactive track height using the ActiveSize and InactiveSize properties of the TrackStyle class. The default value of the ActiveSize and the InactiveSize properties are 8.0 and 6.0 respectively.
<ContentPage
             ...
             xmlns:sliders="clr-namespace:Syncfusion.Maui.Sliders;assembly=Syncfusion.Maui.Sliders"
             xmlns:charts="clr-namespace:Syncfusion.Maui.Charts;assembly=Syncfusion.Maui.Charts">

    <sliders:SfDateTimeRangeSelector Minimum="2010-01-01"
                                     Maximum="2018-01-01"
                                     RangeStart="2012-01-01"
                                     RangeEnd="2016-01-01">

        <sliders:SfDateTimeRangeSelector.TrackStyle>
            <sliders:SliderTrackStyle ActiveSize="10" InactiveSize="8" />
        </sliders:SfDateTimeRangeSelector.TrackStyle>

        <charts:SfCartesianChart>
            ...
        </charts:SfCartesianChart>

    </sliders:SfDateTimeRangeSelector>
</ContentPage>
SfDateTimeRangeSelector rangeSelector = new SfDateTimeRangeSelector();
rangeSelector.Minimum = new DateTime(2010, 01, 01);
rangeSelector.Maximum = new DateTime(2018, 01, 01);
rangeSelector.RangeStart = new DateTime(2012, 01, 01);
rangeSelector.RangeEnd = new DateTime(2016, 01, 01);
rangeSelector.TrackStyle.ActiveSize = 10;
rangeSelector.TrackStyle.InactiveSize = 8;
SfCartesianChart chart = new SfCartesianChart();
rangeSelector.Content = chart;
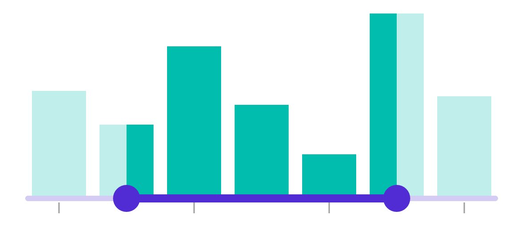
Track extent
Extend the track at the edges using the TrackExtent property. The default value is 0 and it should be in pixels.
<ContentPage
             ...
             xmlns:sliders="clr-namespace:Syncfusion.Maui.Sliders;assembly=Syncfusion.Maui.Sliders"
             xmlns:charts="clr-namespace:Syncfusion.Maui.Charts;assembly=Syncfusion.Maui.Charts">

    <sliders:SfDateTimeRangeSelector Minimum="2019-12-01"
                                     Maximum="2019-12-07"
                                     RangeStart="2019-12-02"
                                     RangeEnd="2019-12-06"
                                     Interval="2"
                                     IntervalType="Days"
                                     ShowTicks="True"
                                     TrackExtent="25">

        <charts:SfCartesianChart>
            ...
        </charts:SfCartesianChart>

    </sliders:SfDateTimeRangeSelector>
</ContentPage>
SfDateTimeRangeSelector rangeSelector = new SfDateTimeRangeSelector();
rangeSelector.Minimum = new DateTime(2019, 12, 01);
rangeSelector.Maximum = new DateTime(2019, 12, 07);
rangeSelector.RangeStart = new DateTime(2009, 12, 02);
rangeSelector.RangeEnd = new DateTime(2000, 12, 06);
rangeSelector.Interval = 2;
rangeSelector.IntervalType = SliderDateIntervalType.Days;
rangeSelector.ShowTicks = true;
rangeSelector.TrackExtent = 25;
SfCartesianChart chart = new SfCartesianChart();
rangeSelector.Content = chart;Without track extent
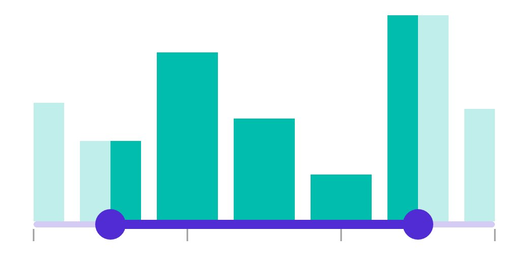
With track extent
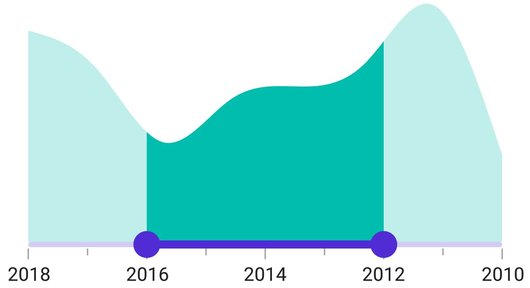
Inverse
Invert the DateTime Range Selector using the IsInversed property. The default value of the IsInversed property is False.
<ContentPage
             ...
             xmlns:sliders="clr-namespace:Syncfusion.Maui.Sliders;assembly=Syncfusion.Maui.Sliders"
             xmlns:charts="clr-namespace:Syncfusion.Maui.Charts;assembly=Syncfusion.Maui.Charts">

    <sliders:SfDateTimeRangeSelector Minimum="2010-01-01"
                                     Maximum="2018-01-01"
                                     RangeStart="2012-01-01"
                                     RangeEnd="2016-01-01"
                                     Interval="2"
                                     ShowLabels="True"
                                     ShowTicks="True"
                                     MinorTicksPerInterval="1"
                                     IsInversed="True">

        <charts:SfCartesianChart>
            ...
        </charts:SfCartesianChart>

    </sliders:SfDateTimeRangeSelector>
</ContentPage>
SfDateTimeRangeSelector rangeSelector = new SfDateTimeRangeSelector();
rangeSelector.Minimum = new DateTime(2010, 01, 01);
rangeSelector.Maximum = new DateTime(2018, 01, 01);
rangeSelector.RangeStart = new DateTime(2012, 01, 01);
rangeSelector.RangeEnd = new DateTime(2016, 01, 01);
rangeSelector.Interval = 2;
rangeSelector.ShowLabels = true;
rangeSelector.ShowTicks = true;
rangeSelector.MinorTicksPerInterval = 1;
rangeSelector.IsInversed = true;
SfCartesianChart chart = new SfCartesianChart();
rangeSelector.Content = chart;