Interval in DateTime Range Selector (SfDateTimeRangeSelector)
17 Jan 20256 minutes to read
This section explains how to add the interval in the DateTime Range Selector control.
Date interval
The DateTime Range Selector has the elements like labels, ticks, and dividers. These elements are rendered based on the Interval, Minimum, and Maximum properties. The default value is 0.
Change the interval type using the IntervalType property. Format or change the label text using the DateFormat property.
For example, if the Minimum is DateTime(2000, 01, 01), Maximum is DateTime(2005, 01, 01), Interval is 1, IntervalType is SliderDateIntervalType.Years, and the DateFormat is yyyy, then the Range Slider will render the labels, major ticks, and dividers at 2000, 2001, 2002, and so on.
<ContentPage
             ...
             xmlns:sliders="clr-namespace:Syncfusion.Maui.Sliders;assembly=Syncfusion.Maui.Sliders"
             xmlns:charts="clr-namespace:Syncfusion.Maui.Charts;assembly=Syncfusion.Maui.Charts">

    <sliders:SfDateTimeRangeSelector Minimum="2000-01-01"
                                     Maximum="2005-01-01"
                                     RangeStart="2001-01-01"
                                     RangeEnd="2004-01-01"
                                     Interval="1"
                                     IntervalType="Years"
                                     DateFormat="yyyy"
                                     ShowLabels="True"
                                     ShowTicks="True"
                                     ShowDividers="True">

        <charts:SfCartesianChart>
            ...
        </charts:SfCartesianChart>

    </sliders:SfDateTimeRangeSelector>
</ContentPage>
SfDateTimeRangeSelector rangeSelector = new SfDateTimeRangeSelector();
rangeSelector.Minimum = new DateTime(2000, 01, 01);
rangeSelector.Maximum = new DateTime(2005, 01, 01);
rangeSelector.RangeStart = new DateTime(2001, 01, 01);
rangeSelector.RangeEnd = new DateTime(2004, 01, 01);
rangeSelector.Interval = 1;
rangeSelector.IntervalType = SliderDateIntervalType.Years;
rangeSelector.DateFormat = "yyyy";
rangeSelector.ShowLabels = true;
rangeSelector.ShowTicks = true;
rangeSelector.ShowDividers = true;
SfCartesianChart chart = new SfCartesianChart();
rangeSelector.Content = chart;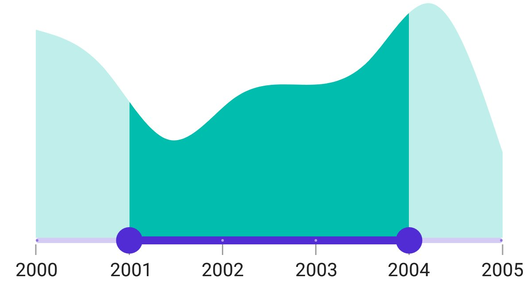
Auto interval
If the ShowTicks or ShowLabels, or ShowDividers properties are True, but the Interval is 0, the Interval will be calculated from the available size. If the IntervalType or DateFormat properties are not set, their values too will be calculated.
For example, if the Minimum is DateTime(2000, 01, 01), the Maximum is DateTime(2001, 01, 01), Interval is 0, and consider the available size as 350, then the Range Selector will render the labels, major ticks, and dividers at Jan 01, 2000, Jul 01, 2000, and Nov 01, 2000 respectively.
<ContentPage
             ...
             xmlns:sliders="clr-namespace:Syncfusion.Maui.Sliders;assembly=Syncfusion.Maui.Sliders"
             xmlns:charts="clr-namespace:Syncfusion.Maui.Charts;assembly=Syncfusion.Maui.Charts">

    <sliders:SfDateTimeRangeSelector Minimum="2000-01-01"
                                     Maximum="2005-01-01"
                                     RangeStart="2001-01-01"
                                     RangeEnd="2004-01-01"
                                     ShowLabels="True"
                                     ShowTicks="True"
                                     ShowDividers="True">

        <charts:SfCartesianChart>
            ...
        </charts:SfCartesianChart>

    </sliders:SfDateTimeRangeSelector>
</ContentPage>
SfDateTimeRangeSelector rangeSelector = new SfDateTimeRangeSelector();
rangeSelector.Minimum = new DateTime(2000, 01, 01);
rangeSelector.Maximum = new DateTime(2005, 01, 01);
rangeSelector.RangeStart = new DateTime(2001, 01, 01);
rangeSelector.RangeEnd = new DateTime(2004, 01, 01);
rangeSelector.ShowLabels = true;
rangeSelector.ShowTicks = true;
rangeSelector.ShowDividers = true;
SfCartesianChart chart = new SfCartesianChart();
rangeSelector.Content = chart;