How can I help you?
Working with Data in Essential JavaScript Chart
Local Data
There are two ways to provide local data to chart.
- You can bind the data to the chart by using the
dataSourceproperty of the series and then you need to map the X and Y value with thexNameandyNameproperties respectively.
NOTE
For the OHLC type series, you have to map four dataSource fields (
high,low,openandclose) to bind the data source and for the bubble series you have to map thesizefield along with thexNameandyName.
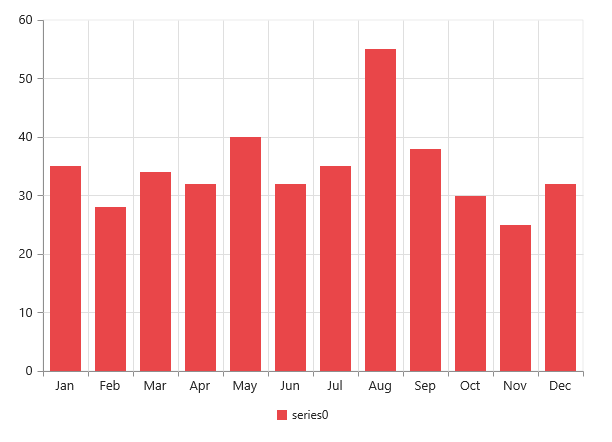
var chartData = [
          { month: 'Jan', sales: 35 }, { month: 'Feb', sales: 28 },  { month: 'Mar', sales: 34 },
          { month: 'Apr', sales: 32 },{ month: 'May', sales: 40 },{ month: 'Jun', sales: 32 },
          { month: 'Jul', sales: 35 },  { month: 'Aug', sales: 55 }, { month: 'Sep', sales: 38 },
          { month: 'Oct', sales: 30 }, { month: 'Nov', sales: 25 }, { month: 'Dec', sales: 32 }];

       $("#container").ejChart({

          series: [{
                // ...
         	//Add datasource and set xName and yName
                dataSource: chartData,
                xName: "month",
                yName: "sales"
             }]

             // ...
        });
Click here to view the local data binding online demo sample.
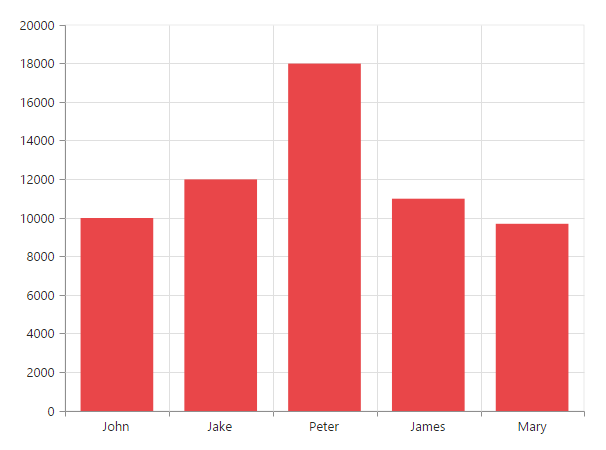
2.You can also plot data to chart using x and y field of points option in the series. Using this property you can customize each and every point in the data.
$("#container").ejChart({

            // ...

           //Initializing Series
           series: [{
               //Adding data points using x and y field of points
               points: [{ x: "John", y: 10000 }, { x: "Jake", y: 12000 }, { x: "Peter", y: 18000 },
                        { x: "James", y: 11000 }, { x: "Mary", y: 9700 }],
               // ...
           }],
            // ...

      });
Remote Data
You can bind the remote data to the chart by using the DataManager and you can use the query property of the series to filter the data from the dataSource.
//Remote URL
        var dataManger = new ej.DataManager({
            url: "http://mvc.syncfusion.com/Services/Northwnd.svc/"
        });
        // Query creation
        var query = ej.Query().from("Orders").take(6);
        $("#container").ejChart({
            series: [{
                type: 'column',
                dataSource: dataManger,
                xName: "ShipCity",
                yName: "Freight",
                query: query,
            }],
        });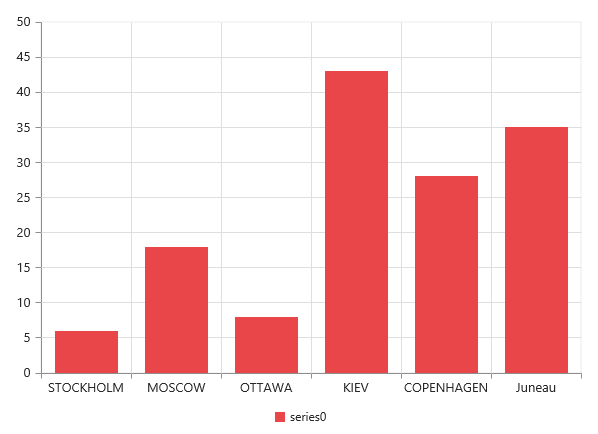
Click here to view the remote data binding online demo sample.
AngularJS Data Binding
Typically, you will assign data directly to chart using dataSource property of the series. In AngularJS, you need to bind the variable, which contains data in the AngularJS scope object, to the dataSource property as illustrated in the following code example,
IMPORTANT
Essential JS includes AngularJS directives for all controls in the ej.widget.angular.min.js script file.
NOTE
All the properties in EjChart supports one way AngularJS binding except inner array properties like series.points[Points], series.trendlines[Trendlines]. Click here to know more about Essential AngularJS and the properties which support two way AngularJS binding in chart.
<html ng-app="syncApp">
<head>
    <script type="text/javascript" src="http://cdn.syncfusion.com/js/assets/external/jquery-2.1.4.min.js"></script>
    <script src="http://cdn.syncfusion.com/js/assets/external/angular.min.js"></script>
    <script src="https://cdn.syncfusion.com/33.1.44/js/web/ej.web.all.min.js"></script>
	<script src="https://cdn.syncfusion.com/33.1.44/js/common/ej.widget.angular.min.js"></script>
</head>
<body ng-controller="Chart">
  <div id="chartContainer" style="width:100%" ej-chart
               e-size-width="800px" e-size-height="600px"
                             e-title-text="AngularJS Support" >
    <e-series>
      <e-series e-name="John" e-dataSource=dataSource e-xName="Day" e-yName="John">
	  </e-series>
    <e-series e-name="Henry"  e-dataSource=dataSource e-xName="Day" e-yName="Henry">
	  </e-series>
    </e-series>
 </div>
</body>
</html>//Data source for chart.
var obj = [
{ "Day": 1, "John": 57, "Henry": 43 },
{ "Day": 2, "John": 73, "Henry": 27 },
{ "Day": 3, "John": 49, "Henry": 51 },
{ "Day": 4, "John": 63, "Henry": 37 },
{ "Day": 5, "John": 44, "Henry": 56 },
{ "Day": 6, "John": 49, "Henry": 51 },
{ "Day": 7, "John": 61, "Henry": 39 },
{ "Day": 8, "John": 35, "Henry": 65 },
{ "Day": 9, "John": 45, "Henry": 55 },
{ "Day": 10, "John": 37, "Henry": 63 }
];
angular.module('syncApp', ['ejangular'])
.controller('Chart', function ($scope) {
//Assigning data to the dataSource variable in the $scope object.
$scope.dataSource = obj;
});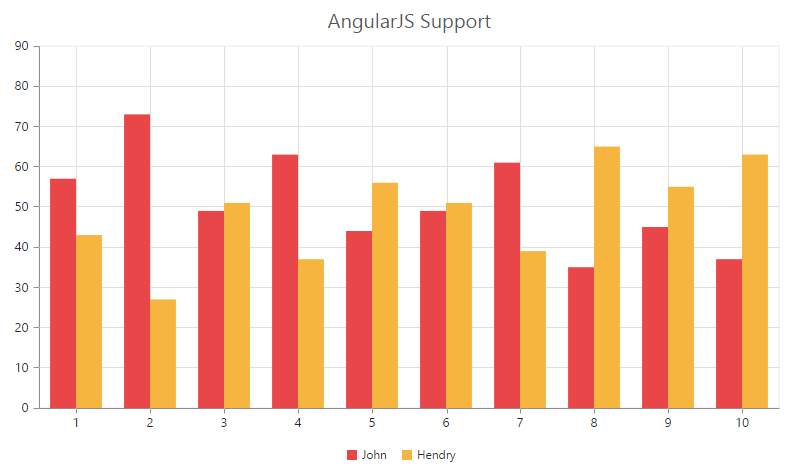
Click here to view the AngularJS data binding online demo sample.