How can I help you?
Localization
EjChart supports localization for its axis labels and tooltip. To render the chart with specific culture you have to refer the corresponding globalize culture script and need to specify the culture name in locale property of chart.
<head>
<!--Refer french globalize culture script-->
<script src="../scripts/cultures/globalize.culture.fr-FR.min.js"></script>
</head>

<body>
    <div id="container"></div>

<script>
      $("#container").ejChart({
                  //  ...
                  //Render chart in French locale
                  locale: 'fr-FR',
      });
  </script>

</body>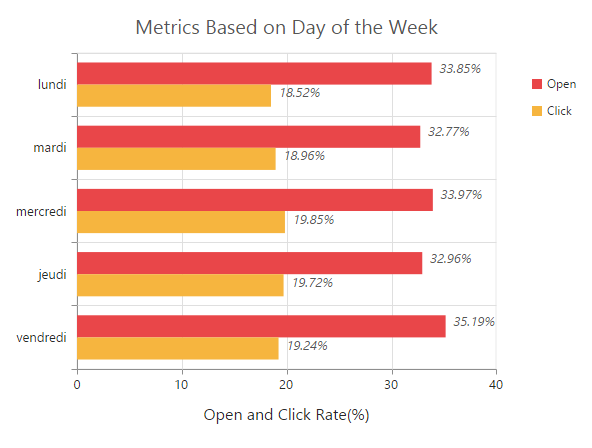
Click here to view the localization chart online demo sample.