How can I help you?
Appearance in Essential JavaScript Chart
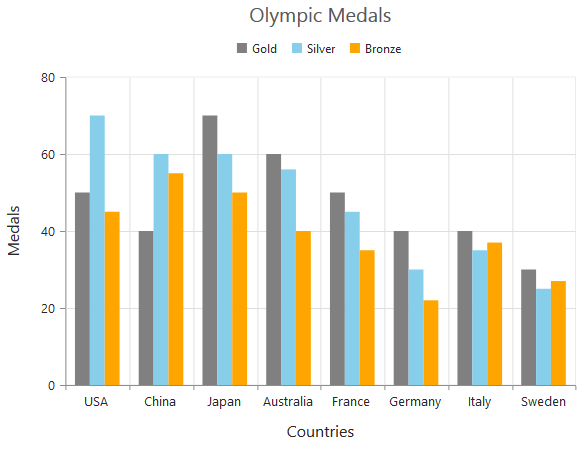
Custom Color Palette
The Chart displays different series in different colors by default. You can customize the color of each series by providing a custom color palette of your choice by using the palette property.
$("#container").ejChart({

            //Providing a custom palette
            palette: [ "grey", "skyblue", "orange", ],

            // ...
         });
NOTE
The Color palette is applied to the points in accumulation type series
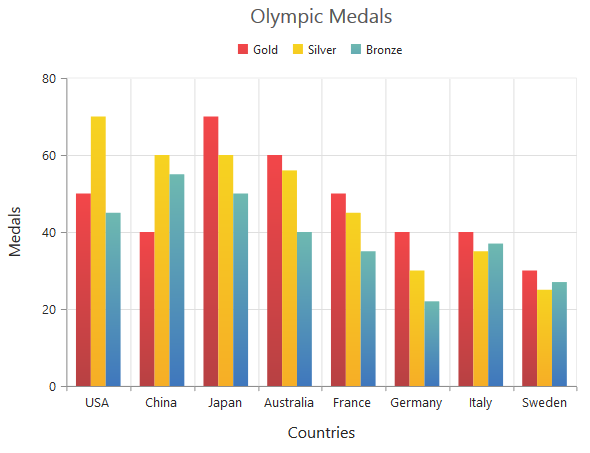
Built-in Themes
Following are the built-in themes available in the Chart
- flatlight
- flatdark
- gradientlight
- gradientdark
- azure
- azuredark
- lime
- limedark
- saffron
- saffrondark
- gradient-azure
- gradient-azuredark
- gradient-lime
- gradient-limedark
- gradient-saffron
- gradient-saffrondark
You can set your desired theme by using the theme property. Flat light is the default theme used in the Chart.
$("#container").ejChart({

            //Using gradient theme
            theme: "gradientlight",

            // ...
        });
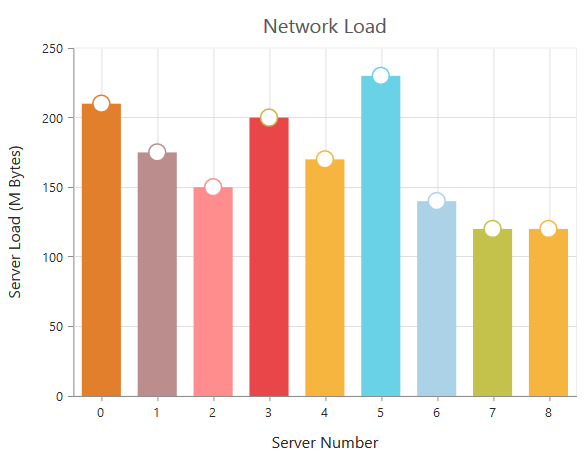
Point level customization
Marker, data label and fill color of each point in a series can be customized individually by using the points collection. The visibility of marker can be customized using visible property. The border of marker shape can be customized using color and width.
The color of marker shape can be specified using fill property.To display the image as marker, need to specify imageURL. The opacity, shape, width, height of marker size also be used to customize the points.
$("#container").ejChart({

           series: [{
                //Customizing marker and fill color of a point
                     points: [
                         {
                            x : 0,
                            y: 210,
                            fill: "#E27F2D",
                            marker: {
                                 visible: true,
                                 // ...
                               }
                         },
                       // ...
                      ],
                 // ...
            }],
            // ...

        });
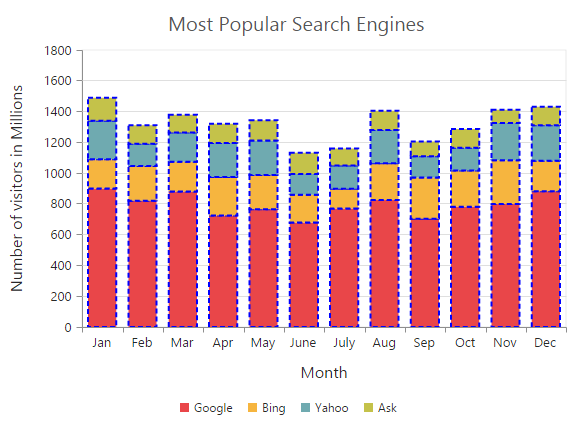
The border color and width property is used to customize the point border. This is applicable only for column type series and accumulation type series. The visibility of legend items can be enabled or disabled using visibleOnLegend.
The showIntermediateSum property shows/hides the intermediate summary from the last intermediate point. To show/hide the total summary of the waterfall series, showTotalSum property can be used.
The close and open value of a point can be specified using open and close property. It is applicable only for financial type series. The size property is used to customize the bubble size in the bubble series. The data label text for the point can be provided using text property.
$("#container").ejChart({

           series: [{
                //Customizing border of a point
                     points: [
                         {
                           text: 'Others',
                           border:{color : "green", width : 2},
                           visibleOnLegend: "hidden",
                           showIntermediateSum : true,
                           showTotalSum : true,
                           close : 50,
						   open : 50,
                           size : 5
                         },
                       // ...
                      ],
                 // ...
            }],
            // ...

        });
Series border customization
To customize the series border color, width and dashArray, you can use border option.
NOTE
Series border can be applied to all the series (except Line, Spline, HiLo, HiLoOpenClose and StepLine series).
$("#container").ejChart({

            //...
            series: [{

                //Change the color, width and dashArray to customize the border of series
                border: { color: "blue", width: 2, dashArray: "5,3" }
                //...
           }]

                //...
     });
Series font customization
To customize the series font colorcolor, fontFamily, fontStyle, fontWeight, opacity and size, you can use font option.
$("#container").ejChart({

            //...
            series: [{

                //Change the color, fontFamily, fontStyle, fontWeight, opacity and size to customize the font of series
                font: {
                    color : "green",
                    fontFamily : "Algerian",
                    fontStyle : "italic",
                    fontWeight : "lighter",
                    opacity : 0.5,
                    size : "14px"
                }
                //...
           }]

                //...
     });
Customizing Name and Opacity of Chart Series
The series name to be displayed on the legend can be provided using name property. The opacity property is used to provide the series opacity.
$("#container").ejChart({
            series :[{
                name: 'India',
                opacity : 0.5
            }]
    });
Customizing data points fill color
The palette is the field name in data source where fill color for all the data points is generated.
$("#container").ejChart({
series :[{palette : "ColorFieldName"}]
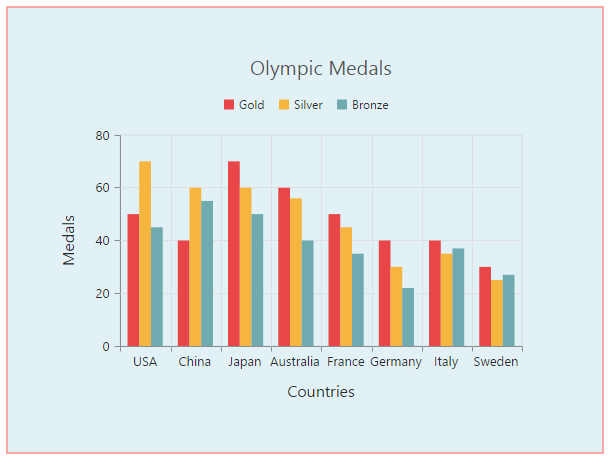
});Chart area customization
The chartArea is the plot area of the chart.
Customize chart background
The Chart background can be customized by using the background property of the Chart. To customize the chart border, use border option of the chart.
The Chart border can be customized by using the color,width and opacity properties.
$("#container").ejChart({

            // ...

            //Customizing Chart background
            background: "skyblue",

            //Customize the chart border and opacity
            border: {color: "#FF0000", width: 2, opacity: 0.35},

            // ...

        });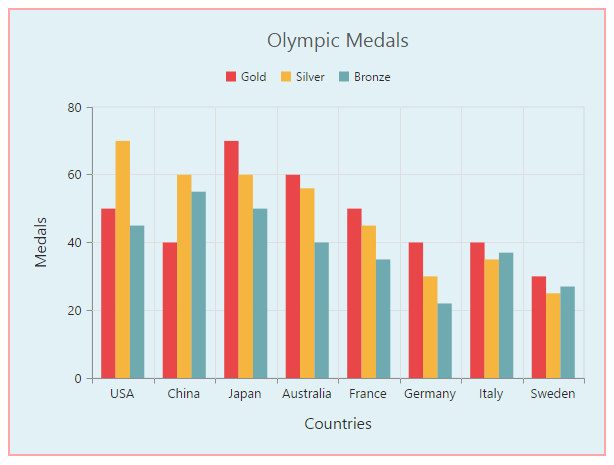
Chart Margin
The Chart margin property is used to add the margin to the chart area at the left, right, top and bottom position.
The left,right,top,
bottom properties are used to add the margin space in respective positions.
$("#container").ejChart({

            // ...

            //Change chart margin to left, right, top and bottom
            margin: { left: 40, right: 40, top: 40, bottom: 40 },

            // ...

        });
Setting background image
Background image can be added to the chart by using the backGroundImageUrl property.
$("#container").ejChart({

            // ...

            //Setting an image as Chart background
            backGroundImageUrl: "images/chart/wheat.png",

            // ...

        });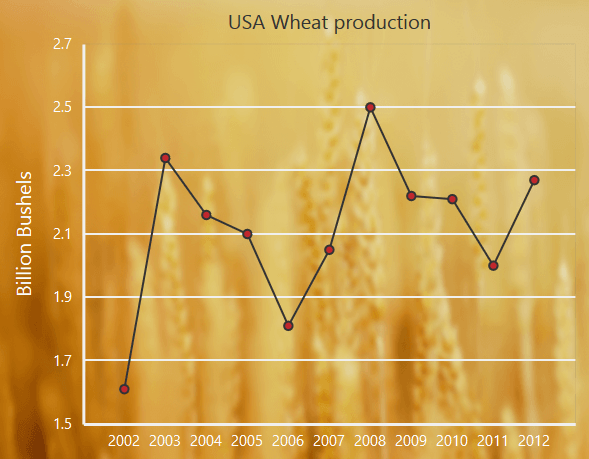
Click here to view our online demo sample for setting Chart background image.
Chart area background
The Chart area background can be customized by using the background property in the chart area.
$("#container").ejChart({

            // ...

           chartArea: {
                 //Setting background for Chart area
                 background: "skyblue"
            },

            // ...

        });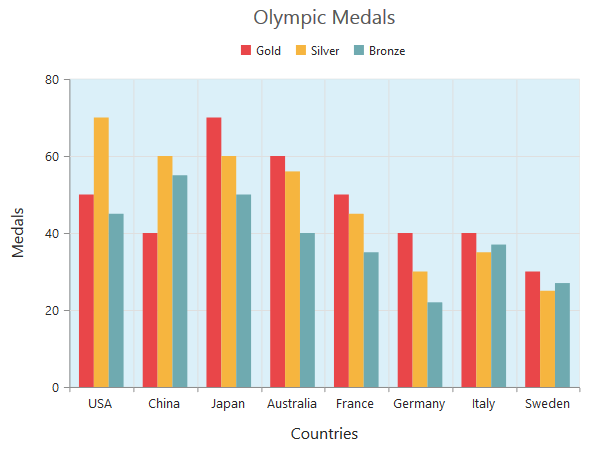
Chart area border
The Chart area border can be customized by using the border property in the chart area.
The color,opacity and width of the borders can be customized using the color,width,opacity properties present inside the border option of the chart area.
$("#container").ejChart({

            // ...

           chartArea: {
                 //Setting border for Chart area
                 border:{ color: "red", width:5, opacity:0.4 }
            },

            // ...

        });
Customize chart area grid bands
You can provide different color for alternate grid rows and columns formed by the grid lines in the chart area by using the alternateGridBand property of the axis. The properties odd and even are used to customize the grid bands at odd and even positions respectively.
$("#container").ejChart({

            // ...

            //Creating horizontal grid bands in chart area
            primaryYAxis: {

               //Customizing horizontal grid bands at even position
               alternateGridBand: {
                   even: {
                            fill: "#A7A9AB",
                            opacity: 0.1,
                          }  }
                   // ...
            },
            // ...

        });
Click here to view the alternate grid band online demo sample.
Animation
You can enable animation by using the enableAnimation property of the series. This animates the chart series on two occasions – when the chart is loaded for the first time or whenever you change the series type by using the type property.
$("#container").ejChart({

            // ...

            series : [{

                 //Enabling animation of series
                 enableAnimation: true,

                 // ...
            }],
            // ...

        });
However, you can force the chart to animate series by calling the animate method as illustrated in the following code example,
$("#container").ejChart({
            series : [{

                 //Enabling animation of series
                 enableAnimation: true,

                 // ...
            }],
            // ...
       });

      //Dynamically animating Chart
      function animateChart(){

           //Calling the animate method for dynamic animation
           $("#container").ejChart("animate");

      }
Control the Speed of animation
To control the speed of animation, you can use the animationDuration property in the series.
$("#container").ejChart({

            // ...

            series : [{

                 //Enabling animation of series
                 enableAnimation: true,
                 animationDuration: "2000",

                 // ...
            }],
            // ...

        });