How can I help you?
Multiple panes
Chart area can be divided into multiple panes using the rowDefinitions and columnDefinitions properties.
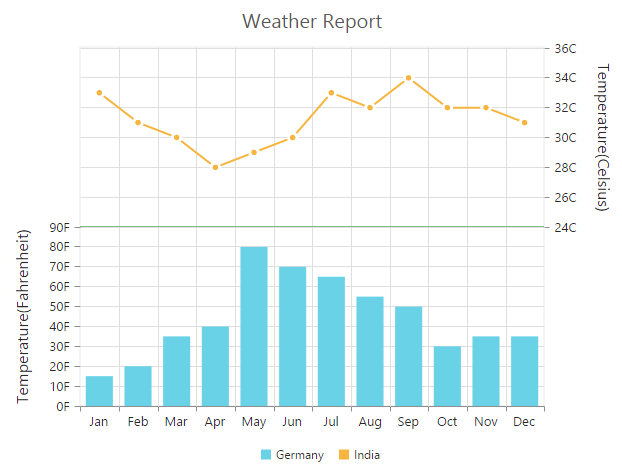
Row Definitions
To split the chart area vertically into a number of rows, use rowDefinitions of the chart.
-
You can allocate space for each row by using the
unitoption that determines whether the chart area should be split by percentage or pixels for the givenrowHeightvalue of the rowDefinitions. -
To associate a vertical axis to a row, specify the rowDefinitions index value to the
rowIndexproperty of the chart axis. -
To customize each row’s horizontal line, use
lineColorandlineWidthproperty.
$("#container").ejChart({

               //  Splitting chart area into multiple rows
                rowDefinitions: [{
                    //  Split first row of the chart area
                    unit : 'percentage',
                    lineColor : 'Gray',
                    rowHeight : 50,
                    lineWidth : 0
                }, {
                    //  Split second row of the chart area
                    unit : 'percentage',
                    lineColor : 'green',
                    rowHeight : 50,
                    lineWidth : 0
                }],

                axes: [{
                          //Create secondary axis and bind it to second row of chart area
                           name: "yAxis1",
                           rowIndex: 1
                    }],
               series: [{

                         //Binding vertical axis name
                         yAxisName: "yAxis1",
                         // ...
                }],
            //  ...

        });
Click here to view the online demo sample for multiple panes.
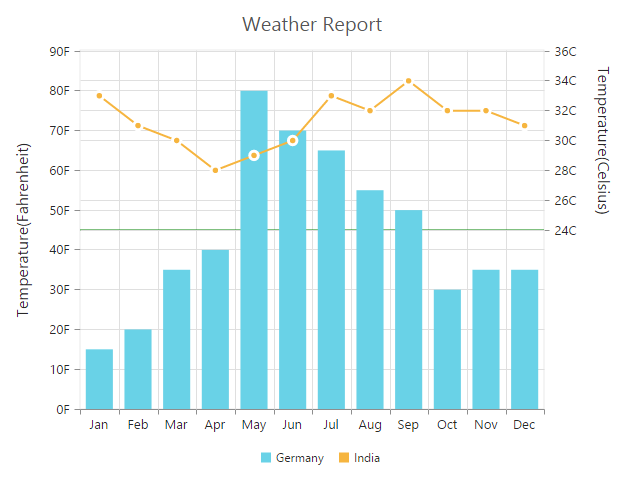
Row Span
For spanning the vertical axis along multiple panes vertically, you can use rowSpan property of axis.
$("#container").ejChart({

            rowDefinitions: [{

                         // ...
                  },{

                         // ...
                  }],
                   axes: [{

                          // ...
                    }],

                primaryYAxis: {
                    //  Span the PrimaryYAxis
                    rowSpan : 2,
                },

               series: [{
                         // ...
                }],
            //  ...

        });
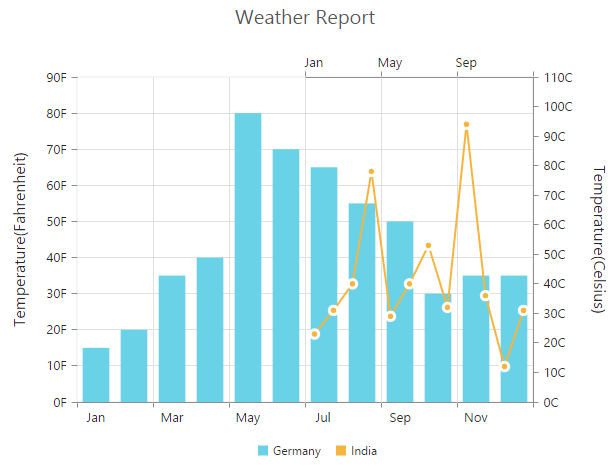
Column Definitions
To split the chart area horizontally into a number of columns, use columnDefinitions of the chart.
-
You can allocate space for each column by using the
unitoption that determines whether the chart area should be split by percentage or pixels for the givencolumnWidthvalue of the columnDefinitions. -
To associate a horizontal axis to a column, specify the columnDefinitions index value to the
columnIndexproperty of the chart axis. -
To customize each column’s horizontal line, use
lineColorandlineWidthproperty.
$("#container").ejChart({

               //  Splitting chart area into multiple columns
                columnDefinitions: [{
                    //  Split first column of the chart area
                    unit : 'percentage',
                    columnWidth : 50,
                }, {
                    //  Split second column of the chart area
                    unit : 'percentage',
                    columnWidth : 50,
                }],

                axes: [{
                          //Create secondary axis and bind it to second column of chart area
                           name: "xAxis1",
                           columnIndex: 1
                    }],
               series: [{

                         //Binding horizontal axis name
                         xAxisName: "xAxis1",
                         // ...
                }],
            //  ...

        });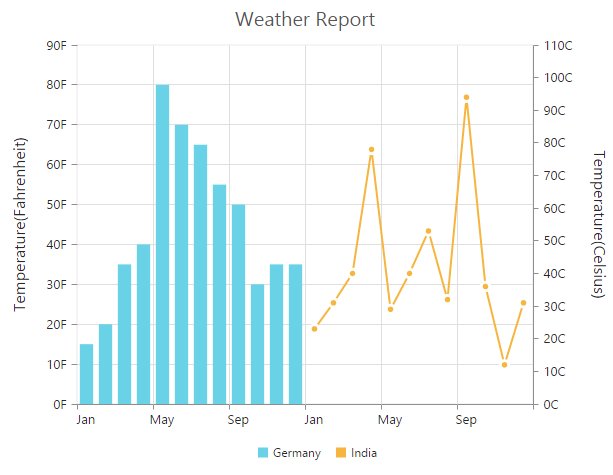
Column Span
For spanning the horizontal axis along multiple panes horizontally, you can use columnSpan property of axis.
$("#container").ejChart({

               columnDefinitions: [{

                          // ...
                  },{

                          // ...
                  }],
                   axes: [{

                          // ...
                    }],

                primaryXAxis: {
                    //  Span the PrimaryXAxis
                    columnSpan : 2,
                },

               series: [{
                         // ...
                }],
            //  ...

        });