How can I help you?
Chart Dimensions
You can set the size of the chart directly on the chart or to the container of the chart. When you do not specify the size, it takes 450px as the height and window size as its width, by default.
Set size for the container
You can customize the chart dimension by setting the width and height for the container element.
<body>
       <div id=”container” style=”width:820px; height:500px;”></div>
         <script type="text/javascript" language="javascript ">

            $(function () {
                $("#container").ejChart();
            });
         </script>
    </body>
Set size in pixels
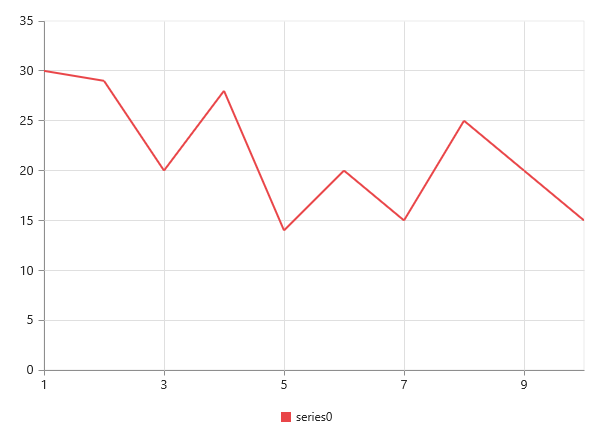
You can also set the chart dimension by using the size property of the chart.
The width and height are set using the size property.
$("#container").ejChart({
         // ...

         //Set size to chart container
         size: { width: '600', height: '450' },
    });
Setting size relative to the container size
You can specify the chart size in percentage by using the size property. The chart gets its dimension with respect to its container.
<body>
    <div id="container" style="width:700px; height:500px"></div>

      <script>
         $("#container").ejChart({
              // ...
              //Set size in percentage to chart container
              size: { width: '80%', height: '90%' },
           });
      </script>
    </body>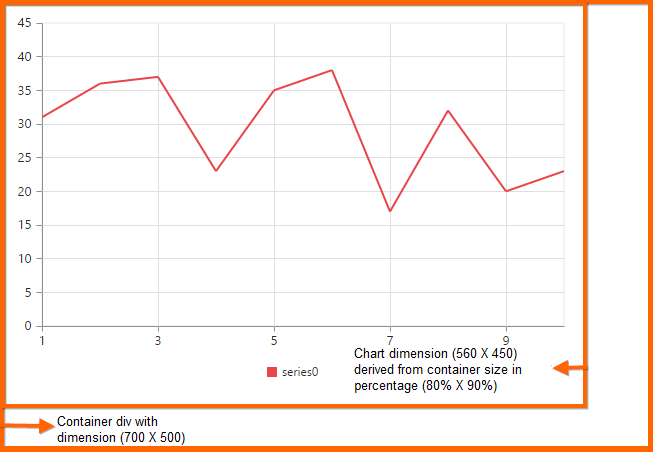
Responsive chart
To resize the Chart when the browser or the chart container is resized, set the isResponsive property to true, where the chart adapts to the changes in size of the container.
$("#container").ejChart({
           // ...
           //Enable isResponsive to change the chart size dynamically.
           isResponsive: true
           // ...
      });