Shape Sublayer in Flutter Maps (SfMaps)
28 May 202524 minutes to read
The shape sublayer is where geographical rendering happens for the sublayer. This is similar to the main shape layer rendering. This section explains how to add a shape sublayer on both the shape layer and tile layer.
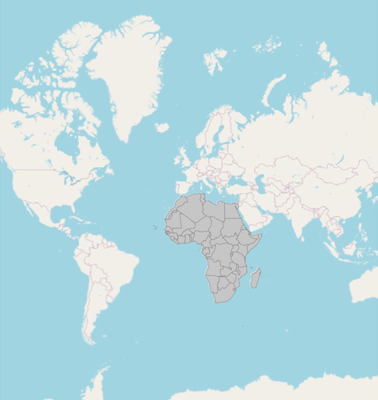
Shape sublayer on tile layer
The sublayers property in MapTileLayer contains a collection of MapSublayer. The actual geographical rendering is done in each MapShapeSublayer. The source property of the MapShapeSublayer is of type MapShapeSource. The path of the .json file which contains the GeoJSON data must be set to the MapShapeSource.
The shapeDataField property of the MapShapeSource is used to refer to the unique field name in the .json file to identify each shape.
late MapShapeSource _sublayerSource;

@override
void initState() {
  super.initState();

  _sublayerSource = MapShapeSource.asset(
      'assets/africa.json',
      shapeDataField: 'name',
  );
}

@override
Widget build(BuildContext context) {
return Scaffold(
    body: Padding(
      padding: const EdgeInsets.only(left: 15, right: 15),
      child: SfMaps(
        layers: [
            MapTileLayer(
              urlTemplate: 'https://tile.openstreetmap.org/{z}/{x}/{y}.png',
              sublayers: [
                MapShapeSublayer(
                  source: _sublayerSource,
                ),
              ],
            ),
          ],
      ),
    ),
  );
}
NOTE
- Refer to the
MapTileLayerdocumentation for adding a tile layer inSfMaps.
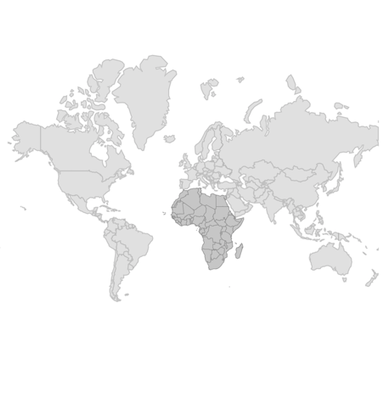
Shape sublayer on shape layer
The sublayers property in MapShapeLayer contains a collection of MapSublayer. The actual geographical rendering is done in each MapShapeSublayer. The source property of the MapShapeSublayer is of type MapShapeSource. The path of the .json file which contains the GeoJSON data must be set to the MapShapeSource.
The shapeDataField property of the MapShapeSource is used to refer to the unique field name in the .json file to identify each shape.
late MapShapeSource _shapeSource;
late MapShapeSource _sublayerSource;

@override
void initState() {
  super.initState();
  _shapeSource = MapShapeSource.asset(
      "assets/world_map.json",
      shapeDataField: "continent",
  );

  _sublayerSource = MapShapeSource.asset(
      'assets/africa.json',
      shapeDataField: 'name',
  );
}

@override
Widget build(BuildContext context) {
return Scaffold(
    body: Padding(
      padding: const EdgeInsets.only(left: 15, right: 15),
      child: SfMaps(
        layers: [
            MapShapeLayer(
              source: _shapeSource,
              sublayers: [
                MapShapeSublayer(
                  source: _sublayerSource,
                ),
              ],
            ),
          ],
      ),
    ),
  );
}
NOTE
- Refer the
MapShapeLayer, for adding shape layer inSfMaps.
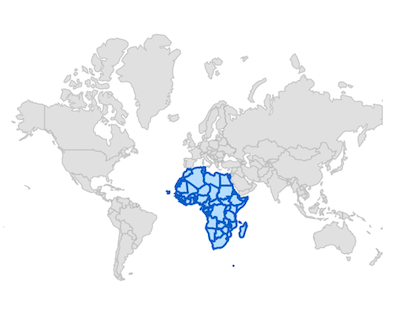
Color and stroke color
You can change the color, strokeColor, and strokeWidth of the shape sublayer using the color, strokeColor, and strokeWidth properties.
NOTE
It is applicable for both tile layer and shape layer.
late MapShapeSource _shapeSource;
late MapShapeSource _sublayerSource;

@override
void initState() {
  super.initState();
  _shapeSource = MapShapeSource.asset(
      "assets/world_map.json",
      shapeDataField: "continent",
  );

  _sublayerSource = MapShapeSource.asset(
      'assets/africa.json',
      shapeDataField: 'name',
  );
}

@override
Widget build(BuildContext context) {
return Scaffold(
    body: Padding(
      padding: const EdgeInsets.only(left: 15, right: 15),
      child: SfMaps(
        layers: [
            MapShapeLayer(
              source: _shapeSource,
              sublayers: [
                MapShapeSublayer(
                  source: _sublayerSource,
                  color: Colors.blue[100],
                  strokeWidth: 2,
                  strokeColor: Colors.blue[800],
                ),
              ],
            ),
          ],
      ),
    ),
  );
}
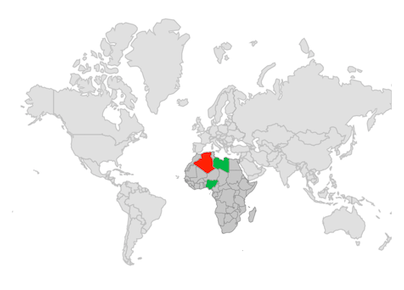
Equal color mapping
You can apply color to the sublayer shape by comparing a value that returns from the shapeColorValueMapper with the MapColorMapper.value. For the matched values, the MapColorMapper.color will be applied to the respective shapes.
late List<Model> data;
late MapShapeSource sublayerDataSource;
late MapShapeSource shapeDataSource;

@override
void initState() {
    data = <Model>[
      Model('Algeria', "Low"),
      Model('Nigeria', "High"),
      Model('Libya', "High"),
    ];

    shapeDataSource = MapShapeSource.asset(
      "assets/world_map.json",
      shapeDataField: 'continent',
    );

    sublayerDataSource = MapShapeSource.asset(
      "assets/africa.json",
      shapeDataField: "name",
      dataCount: data.length,
      primaryValueMapper: (int index) {
        return data[index].state;
      },
      shapeColorValueMapper: (int index) {
        return data[index].storage;
      },
      shapeColorMappers: [
        MapColorMapper(value: "Low", color: Colors.red),
        MapColorMapper(value: "High", color: Colors.green)
      ],
   );
   super.initState();
}

@override
Widget build(BuildContext context) {
  return Scaffold(
     body: Padding(
        padding: EdgeInsets.only(left: 15, right: 15),
        child: SfMaps(
          layers: <MapShapeLayer>[
            MapShapeLayer(
              source: shapeDataSource,
              sublayers: [
                MapShapeSublayer(
                  source: sublayerDataSource,
                )
              ],
            ),
          ],
        ),
      ),
   );
}

class Model {
  const Model(this.state, this.storage);

  final String state;
  final String storage;
}
Range color mapping
You can apply color to the sublayer shape based on whether the value returned from shapeColorValueMapper falls within the MapColorMapper.from and MapColorMapper.to range. Then, the MapColorMapper.color will be applied to the respective shapes.
late List<Model> data;
late MapShapeSource sublayerDataSource;
late MapShapeSource shapeDataSource;

@override
void initState() {
    data = <Model>[
      Model('Algeria', 196),
      Model('Nigeria', 280),
      Model('Libya', 45),
    ];

    shapeDataSource = MapShapeSource.asset(
      "assets/world_map.json",
      shapeDataField: 'continent',
    );

    sublayerDataSource = MapShapeSource.asset(
      "assets/africa.json",
      shapeDataField: "name",
      dataCount: data.length,
      primaryValueMapper: (int index) {
        return data[index].state;
      },
      shapeColorValueMapper: (int index) => data[index].count,
      shapeColorMappers: [
        MapColorMapper(from: 0, to: 100, color: Colors.red),
        MapColorMapper(from: 101, to: 300, color: Colors.green)
      ],
    );
   super.initState();
}

@override
Widget build(BuildContext context) {
  return Scaffold(
     body: Padding(
        padding: EdgeInsets.only(left: 15, right: 15),
        child: SfMaps(
          layers: <MapShapeLayer>[
            MapShapeLayer(
              source: shapeDataSource,
              sublayers: [
                MapShapeSublayer(
                  source: sublayerDataSource,
                )
              ],
            ),
          ],
        ),
      ),
   );
}

class Model {
  const Model(this.state, this.count);

  final String state;
  final double count;
}
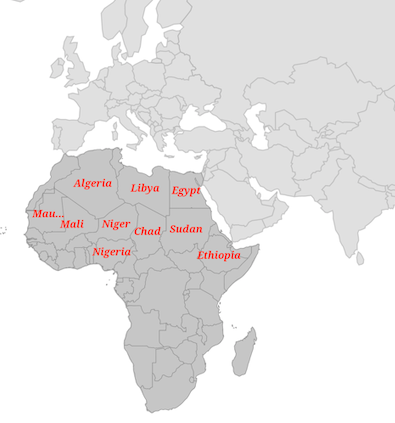
Enable data labels and its customization
You can enable data labels for the shape sublayer using the showDataLabels property and customize the data labels text using the dataLabelMapper property.
NOTE
Refer to the
DataLabelssection, for customizing data labels.
late MapShapeSource _shapeSource;
late MapShapeSource _sublayerSource;
late List<DataModel> _sublayerData;
late MapZoomPanBehavior _zoomPanBehavior;

@override
void initState() {
  super.initState();
  _shapeSource = MapShapeSource.asset(
     "assets/world_map.json",
     shapeDataField: "continent",
  );

  _sublayerData = <DataModel>[
    DataModel('Algeria', Colors.green, 'Algeria'),
    DataModel('Libya', Colors.teal, 'Libya'),
    DataModel('Egypt', Colors.blue, 'Egypt'),
    DataModel('Mali', Colors.purple, 'Mali'),
    DataModel('Niger', Colors.indigo, 'Niger'),
    DataModel('Nigeria', Colors.purpleAccent, 'Nigeria'),
    DataModel('Chad', Colors.lightGreen, 'Chad'),
    DataModel('Sudan', Colors.redAccent, 'Sudan'),
    DataModel('Mauritania', Colors.orange, 'Mauritania'),
    DataModel('South Sudan', Colors.lime, 'South Sudan'),
    DataModel('Ethiopia', Colors.greenAccent, 'Ethiopia')
  ];

  _sublayerSource = MapShapeSource.asset(
    'assets/africa.json',
    shapeDataField: 'name',
    dataCount: _sublayerData.length,
    primaryValueMapper: (int index) => _sublayerData[index].key,
    dataLabelMapper: (int index) => _sublayerData[index].stateCode,
  );
  _zoomPanBehavior = MapZoomPanBehavior(
    zoomLevel: 3,
    focalLatLng: MapLatLng(38.9637, 35.2433),
  );
}

@override
Widget build(BuildContext context) {
  return Scaffold(
    body: SfMaps(
      layers: [
        MapShapeLayer(
          source: _shapeSource,
          zoomPanBehavior: _zoomPanBehavior,
          sublayers: [
            MapShapeSublayer(
              source: _sublayerSource,
              showDataLabels: true,
              dataLabelSettings: const MapDataLabelSettings(
                overflowMode: MapLabelOverflow.ellipsis,
                textStyle: const TextStyle(
                    color: Colors.red,
                    fontSize: 12,
                    fontWeight: FontWeight.bold,
                    fontStyle: FontStyle.italic,
                    fontFamily: 'Times'),
              ),
            ),
          ],
        ),
      ],
    ),
  );
}

class DataModel {
  DataModel(this.key, this.color, this.stateCode);

  final String key;
  final Color color;
  final String stateCode;
}
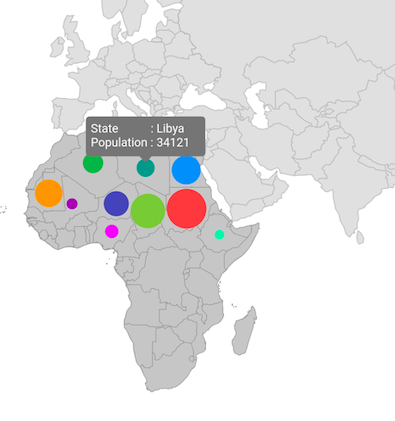
Add bubbles to the sublayer
You can enable bubbles for the shape sublayer using the bubbleSizeMapper property and customize the bubbles appearance using the bubbleSettings property. You can also enable tooltips for the shape sublayer bubbles using the bubbleTooltipBuilder property.
NOTE
It is applicable for both tile layer and shape layer.
NOTE
Refer to the
Bubblessection, to know more about the bubbles customization.
late MapShapeSource _shapeSource;
late MapShapeSource _sublayerSource;
late List<DataModel> _sublayerData;
late MapZoomPanBehavior _zoomPanBehavior;

@override
void initState() {
  super.initState();
  _shapeSource = MapShapeSource.asset(
    "assets/world_map.json",
    shapeDataField: "continent",
  );

  _sublayerData = <DataModel>[
    DataModel('Algeria', Colors.green, 36232),
    DataModel('Libya', Colors.teal, 34121),
    DataModel('Egypt', Colors.blue, 43453),
    DataModel('Mali', Colors.purple, 28123),
    DataModel('Niger', Colors.indigo, 40111),
    DataModel('Nigeria', Colors.purpleAccent, 30232),
    DataModel('Chad', Colors.lightGreen, 48132),
    DataModel('Sudan', Colors.redAccent, 52654),
    DataModel('Mauritania', Colors.orange, 42231),
    DataModel('South Sudan', Colors.lime, 40421),
    DataModel('Ethiopia', Colors.greenAccent, 27198)
  ];

  _sublayerSource = MapShapeSource.asset(
    'assets/africa.json',
    shapeDataField: 'name',
    dataCount: _sublayerData.length,
    primaryValueMapper: (int index) => _sublayerData[index].key,
    bubbleColorValueMapper: (int index) => _sublayerData[index].color,
    bubbleSizeMapper: (int index) => _sublayerData[index].size,
  );
  _zoomPanBehavior = MapZoomPanBehavior(
    zoomLevel: 3,
    focalLatLng: MapLatLng(38.9637, 35.2433),
  );
}

@override
Widget build(BuildContext context) {
  return Scaffold(
    body: SfMaps(
       layers: [
          MapShapeLayer(
            source: _shapeSource,
            zoomPanBehavior: _zoomPanBehavior,
            sublayers: [
              MapShapeSublayer(
                source: _sublayerSource,
                bubbleSettings: const MapBubbleSettings(
                  minRadius: 5,
                  maxRadius: 20,
                ),
                bubbleTooltipBuilder: (BuildContext context, int index) {
                  return Container(
                    height: 40,
                    width: 120,
                    padding: const EdgeInsets.all(5),
                    child: Column(
                      children: [
                        Row(
                          children: [
                            Text('State           : ',
                                style: TextStyle(color: Colors.white)),
                            Text(_sublayerData[index].key,
                                style: TextStyle(color: Colors.white)),
                          ],
                        ),
                        Row(
                          children: [
                            Text('Population : ',
                                style: TextStyle(color: Colors.white)),
                            Text(_sublayerData[index].size.toStringAsFixed(0),
                                style: TextStyle(color: Colors.white)),
                          ],
                        ),
                      ],
                    ),
                  );
                },
              ),
            ],
          ),
        ],
      ),
   );
}

class DataModel {
  DataModel(this.key, this.color, this.size);

  final String key;
  final Color color;
  final double size;
}
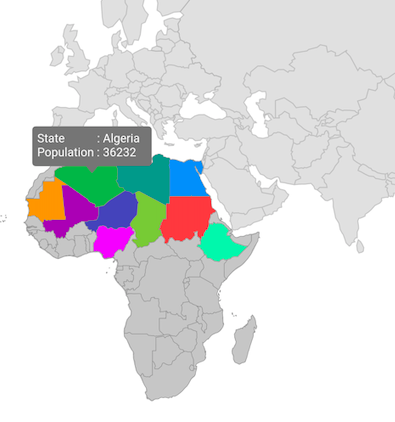
Enable tooltip for shape sublayer
You can enable tooltips for the shape sublayer using the shapeTooltipBuilder property.
NOTE
It is applicable for both tile layer and shape layer.
NOTE
Refer to the
Tooltipsection to know more about the tooltip customization.
late MapShapeSource _shapeSource;
late MapShapeSource _sublayerSource;
late List<DataModel> _sublayerData;
late MapZoomPanBehavior _zoomPanBehavior;

@override
void initState() {
  super.initState();
  _shapeSource = MapShapeSource.asset(
    "assets/world_map.json",
    shapeDataField: "continent",
  );

  _sublayerData = <DataModel>[
      DataModel('Algeria', Colors.green, 36232),
      DataModel('Libya', Colors.teal, 34121),
      DataModel('Egypt', Colors.blue, 43453),
      DataModel('Mali', Colors.purple, 28123),
      DataModel('Niger', Colors.indigo, 40111),
      DataModel('Nigeria', Colors.purpleAccent, 30232),
      DataModel('Chad', Colors.lightGreen, 48132),
      DataModel('Sudan', Colors.redAccent, 52654),
      DataModel('Mauritania', Colors.orange, 42231),
      DataModel('South Sudan', Colors.lime, 40421),
      DataModel('Ethiopia', Colors.greenAccent, 27198)
  ];

   _sublayerSource = MapShapeSource.asset(
      'assets/africa.json',
      shapeDataField: 'name',
      dataCount: _sublayerData.length,
      primaryValueMapper: (int index) => _sublayerData[index].key,
      shapeColorValueMapper: (int index) => _sublayerData[index].color,
   );
   _zoomPanBehavior = MapZoomPanBehavior(
      zoomLevel: 3,
      focalLatLng: MapLatLng(38.9637, 35.2433),
   );
}

@override
Widget build(BuildContext context) {
  return Scaffold(
     body: SfMaps(
        layers: [
          MapShapeLayer(
            source: _shapeSource,
            zoomPanBehavior: _zoomPanBehavior,
            sublayers: [
              MapShapeSublayer(
                source: _sublayerSource,
                shapeTooltipBuilder: (BuildContext context, int index) {
                  return Container(
                    height: 40,
                    width: 120,
                    padding: const EdgeInsets.all(5),
                    child: Column(
                      children: [
                        Row(
                          children: [
                            Text('State           : ',
                                style: TextStyle(color: Colors.white)),
                            Text(_sublayerData[index].key,
                                style: TextStyle(color: Colors.white)),
                          ],
                        ),
                        Row(
                          children: [
                            Text('Population : ',
                                style: TextStyle(color: Colors.white)),
                            Text(_sublayerData[index].size.toStringAsFixed(0),
                                style: TextStyle(color: Colors.white)),
                          ],
                        ),
                      ],
                    ),
                  );
                },
              ),
            ],
          ),
        ],
     ),
   );
}

class DataModel {
   DataModel(this.key, this.color, this.size);

   final String key;
   final Color color;
   final double size;
}
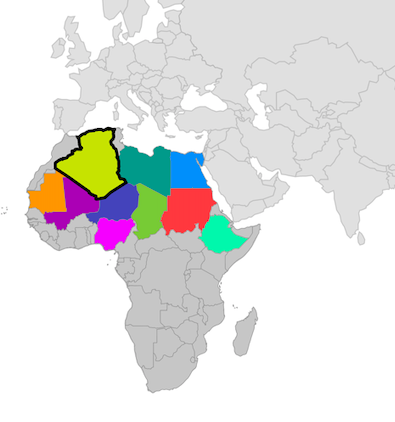
Selection
You can enable shape sublayer selection using the onSelectionChanged callback along with setting the selectedIndex property.
The onSelectionChanged callback is triggered when the user selects a shape by tapping or clicking, or when a shape is selected programmatically. It provides the index of the selected shape.
If the selected shape is tapped or clicked again, the index will be passed as -1, indicating that the shape is unselected.
NOTE
It is applicable for both tile layer and shape layer.
NOTE
Refer the
Shape selectionsection to know more about the selection feature.
late MapShapeSource _shapeSource;
late MapShapeSource _sublayerSource;
late List<DataModel> _sublayerData;
late MapZoomPanBehavior _zoomPanBehavior;
int _selectedIndex = 0;

@override
void initState() {
  super.initState();
  _shapeSource = MapShapeSource.asset(
    "assets/world_map.json",
    shapeDataField: "continent",
  );

  _sublayerData = <DataModel>[
      DataModel('Algeria', Colors.green, 36232),
      DataModel('Libya', Colors.teal, 34121),
      DataModel('Egypt', Colors.blue, 43453),
      DataModel('Mali', Colors.purple, 28123),
      DataModel('Niger', Colors.indigo, 40111),
      DataModel('Nigeria', Colors.purpleAccent, 30232),
      DataModel('Chad', Colors.lightGreen, 48132),
      DataModel('Sudan', Colors.redAccent, 52654),
      DataModel('Mauritania', Colors.orange, 42231),
      DataModel('South Sudan', Colors.lime, 40421),
      DataModel('Ethiopia', Colors.greenAccent, 27198)
  ];

   _sublayerSource = MapShapeSource.asset(
      'assets/africa.json',
      shapeDataField: 'name',
      dataCount: _sublayerData.length,
      primaryValueMapper: (int index) => _sublayerData[index].key,
      shapeColorValueMapper: (int index) => _sublayerData[index].color,
   );
   _zoomPanBehavior = MapZoomPanBehavior(
      zoomLevel: 3,
      focalLatLng: MapLatLng(38.9637, 35.2433),
   );
}

@override
Widget build(BuildContext context) {
  return Scaffold(
     body: SfMaps(
        layers: [
          MapShapeLayer(
            source: _shapeSource,
            zoomPanBehavior: _zoomPanBehavior,
            sublayers: [
              MapShapeSublayer(
                source: _sublayerSource,
                selectedIndex: _selectedIndex,
                onSelectionChanged: (int index) {
                   setState(() {
                      _selectedIndex = index;
                   });
                },
                selectionSettings: const MapSelectionSettings(
                   color: Colors.lime,
                   strokeWidth: 3,
                   strokeColor: Colors.black,
                ),
              ),
            ],
          ),
        ],
     ),
   );
}

class DataModel {
   DataModel(this.key, this.color, this.size);

   final String key;
   final Color color;
   final double size;
}
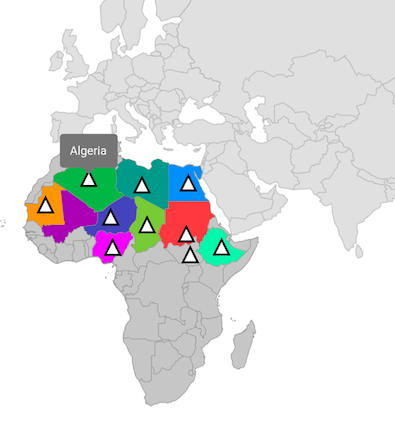
Marker
You can show markers at any position on the map by providing latitude and longitude coordinates to the MapMarker, which is returned from the markerBuilder property.
The markerBuilder callback will be called a number of times equal to the value specified in the initialMarkersCount property. The default value of the initialMarkersCount property is null.
NOTE
It is applicable for both tile layer and shape layer.
NOTE
late MapShapeSource _shapeSource;
late MapShapeSource _sublayerSource;
late List<DataModel> _sublayerData;
late MapZoomPanBehavior _zoomPanBehavior;
late List<MapLatLng> _markerData;

@override
void initState() {
  super.initState();
  _shapeSource = MapShapeSource.asset(
    "assets/world_map.json",
    shapeDataField: "continent",
  );

  _markerData = <MapLatLng>[
     MapLatLng(28.0339, 1.6596),
     MapLatLng(26.3351, 17.2283),
     MapLatLng(26.8208, 30.8025),
     MapLatLng(17.6078, 8.0817),
     MapLatLng(9.0820, 8.6753),
     MapLatLng(9.1450, 40.4897),
     MapLatLng(15.4542, 18.7322),
     MapLatLng(6.8770, 31.3070),
     MapLatLng(21.0079, -10.9408),
     MapLatLng(12.8628, 30.2176),
  ];

  _sublayerData = <DataModel>[
      DataModel('Algeria', Colors.green, 36232),
      DataModel('Libya', Colors.teal, 34121),
      DataModel('Egypt', Colors.blue, 43453),
      DataModel('Mali', Colors.purple, 28123),
      DataModel('Niger', Colors.indigo, 40111),
      DataModel('Nigeria', Colors.purpleAccent, 30232),
      DataModel('Chad', Colors.lightGreen, 48132),
      DataModel('Sudan', Colors.redAccent, 52654),
      DataModel('Mauritania', Colors.orange, 42231),
      DataModel('South Sudan', Colors.lime, 40421),
      DataModel('Ethiopia', Colors.greenAccent, 27198)
  ];

   _sublayerSource = MapShapeSource.asset(
      'assets/africa.json',
      shapeDataField: 'name',
      dataCount: _sublayerData.length,
      primaryValueMapper: (int index) => _sublayerData[index].key,
      shapeColorValueMapper: (int index) => _sublayerData[index].color,
   );
   _zoomPanBehavior = MapZoomPanBehavior(
      zoomLevel: 3,
      focalLatLng: MapLatLng(38.9637, 35.2433),
   );
}

@override
Widget build(BuildContext context) {
  return Scaffold(
     body: SfMaps(
        layers: [
          MapShapeLayer(
            source: _shapeSource,
            zoomPanBehavior: _zoomPanBehavior,
            sublayers: [
              MapShapeSublayer(
                source: _sublayerSource,
                initialMarkersCount: _markerData.length,
                markerBuilder: (BuildContext context, int index) {
                   return MapMarker(
                      latitude: _markerData[index].latitude,
                      longitude: _markerData[index].longitude,
                      iconColor: Colors.white,
                      iconStrokeWidth: 2,
                      iconStrokeColor: Colors.black,
                      iconType: MapIconType.triangle,
                      size: Size(15, 15),
                   );
                },
                markerTooltipBuilder: (BuildContext context, int index) {
                  return Padding(
                     padding: EdgeInsets.all(10),
                     child: Text(_sublayerData[index].key,
                       style: TextStyle(color: Colors.white)),
                  );
                },
              ),
            ],
          ),
        ],
     ),
   );
}

class DataModel {
   DataModel(this.key, this.color, this.size);

   final String key;
   final Color color;
   final double size;
}
NOTE
You can refer to our Flutter Maps feature tour page for its groundbreaking feature representations. You can also explore our Flutter Maps Sublayer example that shows how to configure a Maps in Flutter.