How can I help you?
Legend in Flutter Maps (SfMaps)
28 Jul 202524 minutes to read
You can provide clear information on the data plotted on the map using legend.
Shape legend
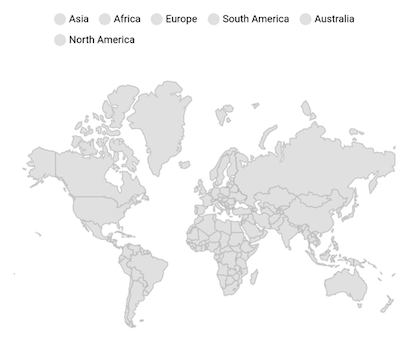
You can show shape legend by setting the MapShapeLayer.legend property as MapLegend(MapElement.shape). By default, the legend item’s text is rendered based on the value of shapeDataField property. The default value of the legend property is null and hence the legend will not be shown by default.
late MapShapeSource _shapeSource;

@override
void initState() {
  super.initState();

  _shapeSource = MapShapeSource.asset(
    "assets/world_map.json",
    shapeDataField: "continent",
  );
}

@override
Widget build(BuildContext context) {
    return Scaffold(
      body: Center(
        child: SizedBox(
          height: 350,
          child: Padding(
            padding: const EdgeInsets.only(left: 15, right: 15),
            child: SfMaps(
              layers: [
                MapShapeLayer(
                  source: _shapeSource,
                  legend: MapLegend(MapElement.shape),
                ),
              ],
            ),
          ),
        ),
      ),
   );
}
NOTE
- Refer to
MapLegend.bar, for showing bar legend.
Bubble legend
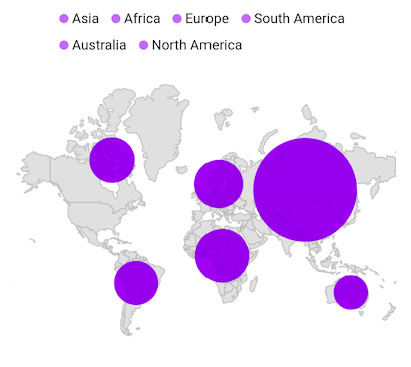
You can show bubble legend by setting the MapShapeLayer.legend property as MapLegend(MapElement.bubble). By default, the legend item’s text is rendered based on the value of shapeDataField property.
late List<Model> _data;
late MapShapeSource _shapeSource;

@override
void initState() {
  super.initState();
  _data = <Model>[
    Model('Asia', 150),
    Model('Africa', 45),
    Model('Europe', 34),
    Model('North America', 28),
    Model('South America', 25),
    Model('Australia', 5),
  ];

  _shapeSource = MapShapeSource.asset(
    "assets/world_map.json",
    shapeDataField: "continent",
    dataCount: _data.length,
    primaryValueMapper: (int index) => _data[index].continent,
    bubbleSizeMapper: (int index) => _data[index].populationDensityPerSqKm,
  );
}

@override
Widget build(BuildContext context) {
  return Scaffold(
    body: Center(
      child: Container(
        padding: const EdgeInsets.only(left: 10, right: 15, top: 30),
        height: 350,
        child: SfMaps(
          layers: [
            MapShapeLayer(
              source: _shapeSource,
              legend: MapLegend(MapElement.bubble),
              bubbleSettings: const MapBubbleSettings(
                maxRadius: 45,
                minRadius: 15,
              ),
            )
          ],
        ),
      ),
    ),
  );
}

class Model {
  const Model(this.continent, this.populationDensityPerSqKm);

  final String continent;
  final double populationDensityPerSqKm;
}
NOTE
- Refer to
MapLegend.bar, for showing bar legend.
Bar shape legend
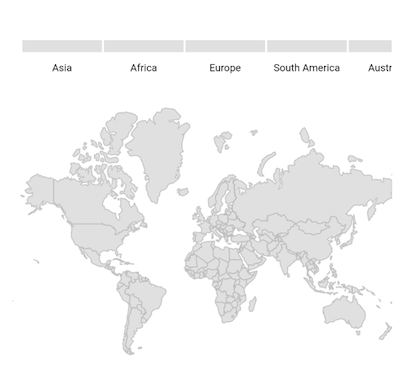
You can show bar shape legend by setting the MapShapeLayer.legend property as MapLegend.bar(MapElement.shape). By default, the legend item’s text is rendered based on the value of shapeDataField property.
late MapShapeSource _shapeSource;

@override
void initState() {
  super.initState();

  _shapeSource = MapShapeSource.asset(
    "assets/world_map.json",
    shapeDataField: "continent",
  );
}

@override
Widget build(BuildContext context) {
    return Scaffold(
      body: Center(
        child: Container(
          height: 350,
          child: Padding(
            padding: const EdgeInsets.only(left: 15, right: 15),
            child: SfMaps(
              layers: [
                MapShapeLayer(
                  source: _shapeSource,
                  legend: MapLegend.bar(MapElement.shape),
                ),
              ],
            ),
          ),
        ),
      ),
   );
}
NOTE
- Refer to
MapLegend, for showing default legend.
Bar bubble legend
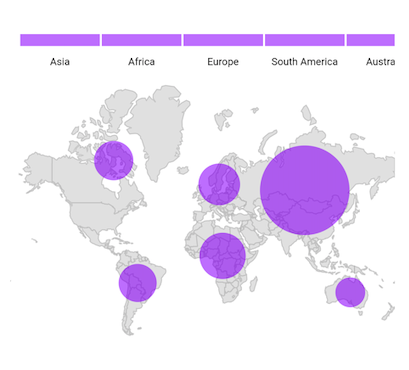
You can show bar bubble legend by setting the MapShapeLayer.legend property as MapLegend.bar(MapElement.bubble). By default, the legend item’s text is rendered based on the value of shapeDataField property.
late List<Model> _data;
late MapShapeSource _shapeSource;

@override
void initState() {
  super.initState();
  _data = <Model>[
    Model('Asia', 150),
    Model('Africa', 45),
    Model('Europe', 34),
    Model('North America', 28),
    Model('South America', 25),
    Model('Australia', 5),
  ];

  _shapeSource = MapShapeSource.asset(
    "assets/world_map.json",
    shapeDataField: "continent",
    dataCount: _data.length,
    primaryValueMapper: (int index) => _data[index].continent,
    bubbleSizeMapper: (int index) => _data[index].populationDensityPerSqKm,
  );
}

@override
Widget build(BuildContext context) {
  return Scaffold(
    body: Center(
      child: Container(
        padding: const EdgeInsets.only(left: 10, right: 15, top: 30),
        height: 350,
        child: SfMaps(
          layers: [
            MapShapeLayer(
              source: _shapeSource,
              legend: MapLegend.bar(MapElement.bubble),
              bubbleSettings: const MapBubbleSettings(
                maxRadius: 45,
                minRadius: 15,
              ),
            )
          ],
        ),
      ),
    ),
  );
}

class Model {
  const Model(this.continent, this.populationDensityPerSqKm);

  final String continent;
  final double populationDensityPerSqKm;
}
NOTE
- Refer to
MapLegend, for showing default legend.
Title
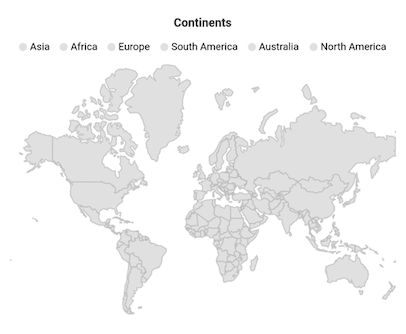
You can add title to the legend using the MapLegend.title property.
NOTE
It is applicable for both shape and bar legend.
late MapShapeSource _dataSource;
late List<DataModel> _data;

@override
void initState() {
   _data = const <DataModel>[
      DataModel('Asia', 280),
      DataModel('Europe', 120),
      DataModel('Africa', 40),
      DataModel('North America', 90),
      DataModel('South America', 190),
      DataModel('Australia', 210),
   ];

   _dataSource = MapShapeSource.asset(
      'assets/world_map.json',
      shapeDataField: 'continent',
      dataCount: _data.length,
      primaryValueMapper: (int index) => _data[index].continent,
   );
   super.initState();
}

@override
Widget build(BuildContext context) {
  return Scaffold(
     body: Column(
        children: [
          SfMaps(
            layers: <MapShapeLayer>[
              MapShapeLayer(
                source: _dataSource,
                legend: MapLegend(
                  MapElement.shape,
                  title: Text('Continents',
                      style:
                          TextStyle(fontSize: 14, fontWeight: FontWeight.bold)),
                ),
              ),
            ],
          ),
        ],
      ),
   );
}

class DataModel {
  const DataModel(this.continent, this.size);

  final String continent;
  final double size;
}
Icon and text customization
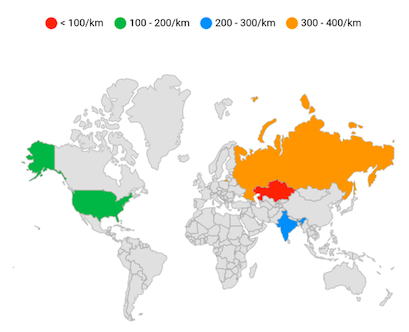
The icons color of the legend is applied based on the colors returned from the MapShapeLayerDelegate.shapeColorValueMapper property and the text is taken from the shapeDataField. It is possible to customize the legend icons color and texts using the MapColorMapper.color and MapColorMapper.text properties based on the MapColorMapper.value or MapColorMapper.from and MapColorMapper.to properties.
late List<Model> _data;
late MapShapeSource _shapeSource;

@override
void initState() {
  super.initState();
  _data = <Model>[
      Model('India', 280),
      Model('United States of America', 190),
      Model('Kazakhstan', 37),
      Model('Russia', 310)
  ];

  _shapeSource = MapShapeSource.asset("assets/world_map.json",
        shapeDataField: "name",
        dataCount: _data.length,
        primaryValueMapper: (int index) => _data[index].country,
        shapeColorValueMapper: (int index) => _data[index].density,
        shapeColorMappers: [
          MapColorMapper(from: 0, to: 100, color: Colors.red, text: '< 100/km'),
          MapColorMapper(
              from: 101, to: 200, color: Colors.green, text: '100 - 200/km'),
          MapColorMapper(
              from: 201, to: 300, color: Colors.blue, text: '200 - 300/km'),
          MapColorMapper(
              from: 301, to: 400, color: Colors.orange, text: '300 - 400/km'),
  ]);
}

@override
Widget build(BuildContext context) {
    return Scaffold(
      body: Center(
        child: Container(
          height: 350,
          child: Padding(
            padding: const EdgeInsets.only(left: 15, right: 15),
            child: SfMaps(
              layers: [
                MapShapeLayer(
                  source: _shapeSource,
                  legend: MapLegend(MapElement.shape),
                )
              ],
            ),
          ),
        ),
      ),
   );
}

class Model {
  const Model(this.country, this.density);

  final String country;
  final double density;
}
First segment label customization
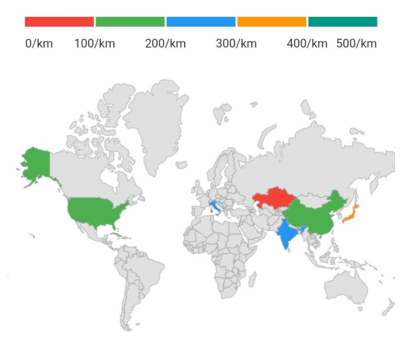
You can customize the first segment label of the legend using the MapColorMapper.text property with curly braces. The first curly brace value will be applied as segment start label and the next curly brace value will be applied as segment end label. By default, the MapColorMapper.from value is placed at the starting position of first segment and the MapColorMapper.to value is placed at the ending position of the first segment.
late List<DataModel> _data;
late MapShapeSource _shapeSource;

@override
void initState() {
  _data = <DataModel>[
    DataModel('India', 280),
    DataModel('United States of America', 190),
    DataModel('Kazakhstan', 37),
    DataModel('Italy', 201),
    DataModel('Japan', 335),
    DataModel('Cuba', 103),
    DataModel('China', 148)
  ];

  _shapeSource = MapShapeSource.asset(
    "assets/world_map.json",
    shapeDataField: "name",
    dataCount: _data.length,
    primaryValueMapper: (int index) => _data[index].country,
    shapeColorValueMapper: (int index) => _data[index].density,
    shapeColorMappers: [
      MapColorMapper(
          from: 0, to: 100, color: Colors.red, text: '{0/km},{100/km}'),
      MapColorMapper(from: 101, to: 200, color: Colors.green, text: '200/km'),
      MapColorMapper(from: 201, to: 300, color: Colors.blue, text: '300/km'),
      MapColorMapper(from: 301, to: 400, color: Colors.orange, text: '400/km'),
      MapColorMapper(from: 401, to: 500, color: Colors.teal, text: '500/km'),
    ],
  );
  super.initState();
}

@override
Widget build(BuildContext context) {
  return Scaffold(
    body: Center(
      child: Container(
        height: 350,
        child: Padding(
          padding: const EdgeInsets.only(left: 15, right: 15),
          child: SfMaps(
            layers: [
              MapShapeLayer(
                source: _shapeSource,
                legend: MapLegend.bar(
                  MapElement.shape,
                ),
              )
            ],
          ),
        ),
      ),
    ),
  );
}

class DataModel {
  const DataModel(this.country, this.density);

  final String country;
  final double density;
}
Position
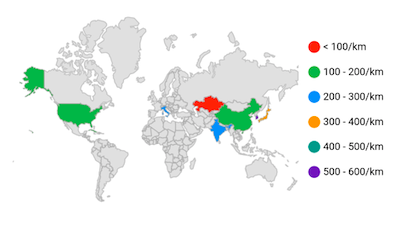
You can position the legend items in different directions using the MapLegend.position property. The default value of the position property is MapLegendPosition.top. The possible values are left, right, top, and bottom.
late List<Model> _data;
late MapShapeSource _shapeSource;

@override
void initState() {
  super.initState();
  _data = <Model>[
      Model('India', 280),
      Model('United States of America', 190),
      Model('Kazakhstan', 37),
      Model('Italy', 201),
      Model('Korea', 512),
      Model('Japan', 335),
      Model('Cuba', 103),
      Model('China', 148)
  ];

  _shapeSource = MapShapeSource.asset("assets/world_map.json",
        shapeDataField: "name",
        dataCount: _data.length,
        primaryValueMapper: (int index) => _data[index].country,
        shapeColorValueMapper: (int index) => _data[index].density,
        shapeColorMappers: [
          MapColorMapper(from: 0, to: 100, color: Colors.red, text: '< 100/km'),
          MapColorMapper(
              from: 101, to: 200, color: Colors.green, text: '100 - 200/km'),
          MapColorMapper(
              from: 201, to: 300, color: Colors.blue, text: '200 - 300/km'),
          MapColorMapper(
              from: 301, to: 400, color: Colors.orange, text: '300 - 400/km'),
          MapColorMapper(
              from: 401, to: 500, color: Colors.teal, text: '400 - 500/km'),
          MapColorMapper(
              from: 501,
              to: 600,
              color: Colors.deepPurple,
              text: '500 - 600/km'),
    ]);
}

@override
Widget build(BuildContext context) {
    return Scaffold(
      body: Center(
        child: Container(
          height: 350,
          child: Padding(
            padding: const EdgeInsets.only(left: 15, right: 15),
            child: SfMaps(
              layers: [
                MapShapeLayer(
                  source: _shapeSource,
                  legend: MapLegend(
                    MapElement.shape,
                    position: MapLegendPosition.right,
                  ),
                )
              ],
            ),
          ),
        ),
      ),
   );
}

class Model {
  const Model(this.country, this.density);

  final String country;
  final double density;
}
NOTE
- Refer to
offset, for placing the legend in custom position.
Offset
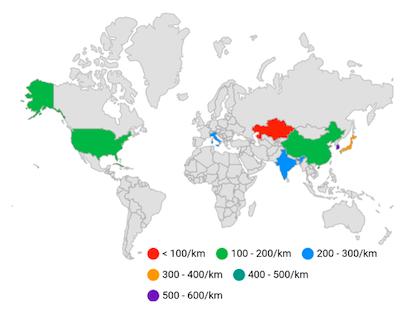
You can place the legend in custom position using the MapLegend.offset property. The default value of the offset property is null.
If the property MapLegend.offset has been set with the property MapLegend.position as top, then the legend will be placed in top but with absolute position, i.e. legend will not take dedicated position for it and will be drawn at the top of the map.
late List<Model> _data;
late MapShapeSource _shapeSource;

@override
void initState() {
    super.initState();
    _data = <Model>[
      Model('India', 280),
      Model('United States of America', 190),
      Model('Kazakhstan', 37),
      Model('Italy', 201),
      Model('Korea', 512),
      Model('Japan', 335),
      Model('Cuba', 103),
      Model('China', 148)
    ];

    _shapeSource = MapShapeSource.asset("assets/world_map.json",
        shapeDataField: "name",
        dataCount: _data.length,
        primaryValueMapper: (int index) => _data[index].country,
        shapeColorValueMapper: (int index) => _data[index].density,
        shapeColorMappers: [
          MapColorMapper(from: 0, to: 100, color: Colors.red, text: '< 100/km'),
          MapColorMapper(
              from: 101, to: 200, color: Colors.green, text: '100 - 200/km'),
          MapColorMapper(
              from: 201, to: 300, color: Colors.blue, text: '200 - 300/km'),
          MapColorMapper(
              from: 301, to: 400, color: Colors.orange, text: '300 - 400/km'),
          MapColorMapper(
              from: 401, to: 500, color: Colors.teal, text: '400 - 500/km'),
          MapColorMapper(
              from: 501,
              to: 600,
              color: Colors.deepPurple,
              text: '500 - 600/km'),
    ]);
}

@override
Widget build(BuildContext context) {
    return Scaffold(
      body: Center(
        child: Container(
          height: 350,
          child: Padding(
            padding: const EdgeInsets.only(left: 15, right: 15),
            child: SfMaps(
              layers: [
                MapShapeLayer(
                  source: _shapeSource,
                  legend: MapLegend(
                    MapElement.shape,
                    offset: Offset(60, 275)),
                )
              ],
            ),
          ),
        ),
      ),
   );
}

class Model {
  const Model(this.country, this.density);

  final String country;
  final double density;
}
Overflow mode
For default legend
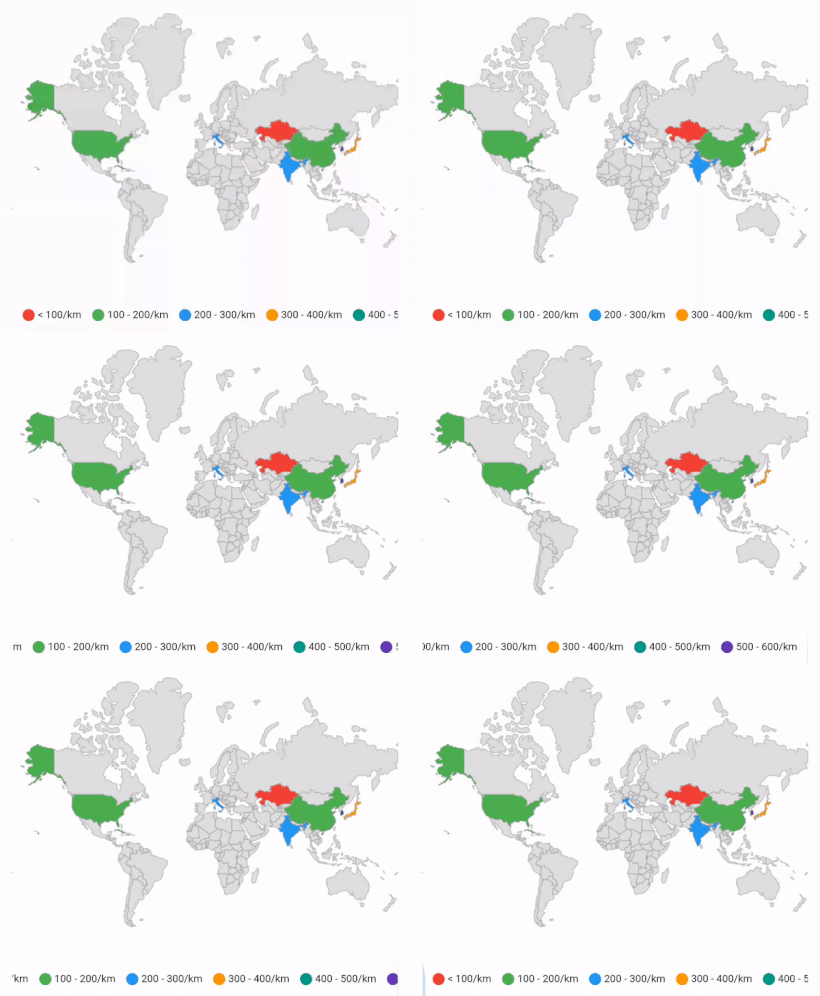
You can wrap or scroll the legend items using the MapLegend.overflowMode property. The default value of the overflowMode property is MapLegendOverflowMode.wrap. The possible values are scroll and wrap.
If the legend position is left or right, then the default scroll direction is vertical.
If the legend position is top or bottom, then the default scroll direction is horizontal.
late List<Model> _data;
late MapShapeSource _shapeSource;

@override
void initState() {
   super.initState();
   _data = <Model>[
      Model('India', 280),
      Model('United States of America', 190),
      Model('Kazakhstan', 37),
      Model('Italy', 201),
      Model('Korea', 512),
      Model('Japan', 335),
      Model('Cuba', 103),
      Model('China', 148)
   ];

   _shapeSource = MapShapeSource.asset("assets/world_map.json",
        shapeDataField: "name",
        dataCount: _data.length,
        primaryValueMapper: (int index) => _data[index].country,
        shapeColorValueMapper: (int index) => _data[index].density,
        shapeColorMappers: [
          MapColorMapper(from: 0, to: 100, color: Colors.red, text: '< 100/km'),
          MapColorMapper(
              from: 101, to: 200, color: Colors.green, text: '100 - 200/km'),
          MapColorMapper(
              from: 201, to: 300, color: Colors.blue, text: '200 - 300/km'),
          MapColorMapper(
              from: 301, to: 400, color: Colors.orange, text: '300 - 400/km'),
          MapColorMapper(
              from: 401, to: 500, color: Colors.teal, text: '400 - 500/km'),
          MapColorMapper(
              from: 501,
              to: 600,
              color: Colors.deepPurple,
              text: '500 - 600/km'),
        ]);
}

@override
Widget build(BuildContext context) {
    return Scaffold(
      body: Center(
        child: Container(
          height: 350,
          child: Padding(
            padding: const EdgeInsets.only(left: 15, right: 15),
            child: SfMaps(
              layers: [
                MapShapeLayer(
                  source: _shapeSource,
                  legend: MapLegend(
                    MapElement.shape,
                    position: MapLegendPosition.bottom,
                    overflowMode: MapLegendOverflowMode.scroll,
                  ),
                )
              ],
            ),
          ),
        ),
      ),
   );
}

class Model {
  const Model(this.country, this.density);

  final String country;
  final double density;
}
For bar legend
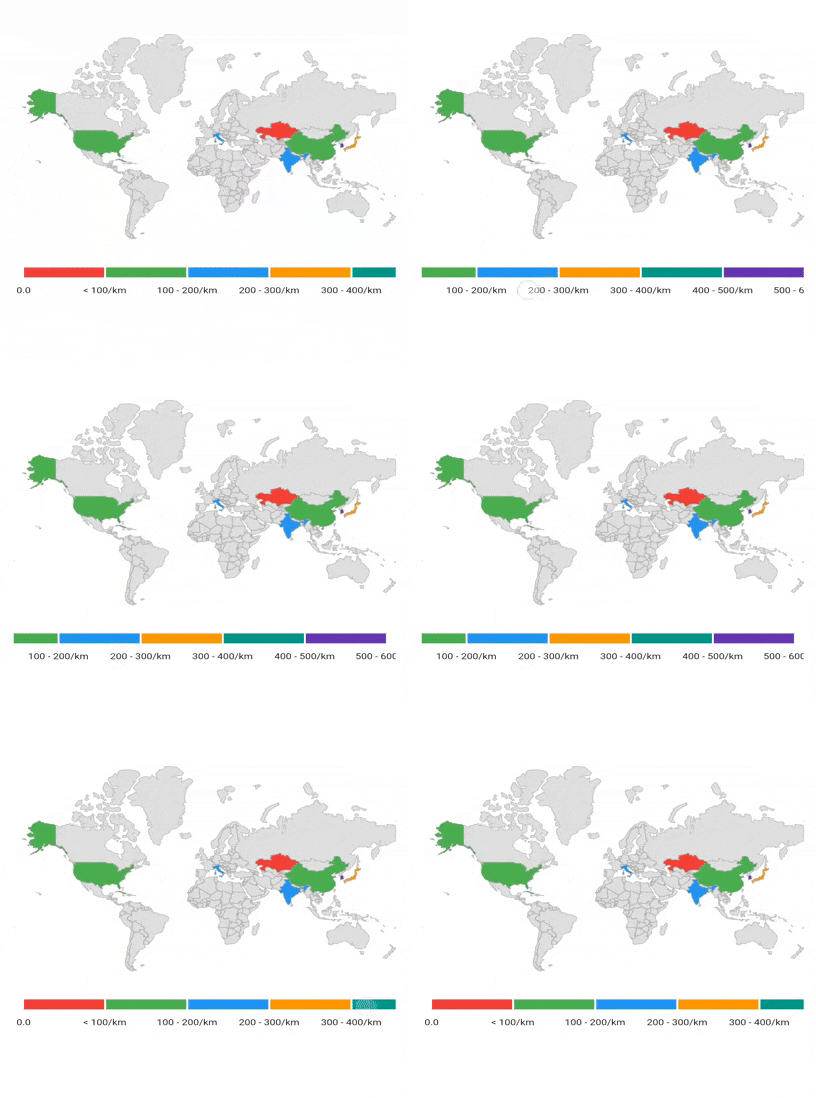
You can wrap or scroll the bar legend items using the MapLegend.overflowMode property. The default value of the overflowMode property is MapLegendOverflowMode.scroll. The possible values are scroll and wrap.
If the legend position is left or right, then the default scroll direction is vertical.
If the legend position is top or bottom, then the default scroll direction is horizontal.
late List<Model> _data;
late MapShapeSource _shapeSource;

@override
void initState() {
   super.initState();
   _data = <Model>[
      Model('India', 280),
      Model('United States of America', 190),
      Model('Kazakhstan', 37),
      Model('Italy', 201),
      Model('Korea', 512),
      Model('Japan', 335),
      Model('Cuba', 103),
      Model('China', 148)
   ];

   _shapeSource = MapShapeSource.asset("assets/world_map.json",
        shapeDataField: "name",
        dataCount: _data.length,
        primaryValueMapper: (int index) => _data[index].country,
        shapeColorValueMapper: (int index) => _data[index].density,
        shapeColorMappers: [
          MapColorMapper(from: 0, to: 100, color: Colors.red, text: '< 100/km'),
          MapColorMapper(
              from: 101, to: 200, color: Colors.green, text: '100 - 200/km'),
          MapColorMapper(
              from: 201, to: 300, color: Colors.blue, text: '200 - 300/km'),
          MapColorMapper(
              from: 301, to: 400, color: Colors.orange, text: '300 - 400/km'),
          MapColorMapper(
              from: 401, to: 500, color: Colors.teal, text: '400 - 500/km'),
          MapColorMapper(
              from: 501,
              to: 600,
              color: Colors.deepPurple,
              text: '500 - 600/km'),
        ]);
}

@override
Widget build(BuildContext context) {
    return Scaffold(
      body: Center(
        child: Container(
          height: 350,
          child: Padding(
            padding: const EdgeInsets.only(left: 15, right: 15),
            child: SfMaps(
              layers: [
                MapShapeLayer(
                  source: _shapeSource,
                  legend: MapLegend.bar(
                    MapElement.shape,
                    position: MapLegendPosition.bottom,
                    edgeLabelsPlacement: MapLegendEdgeLabelsPlacement.center,
                    overflowMode: MapLegendOverflowMode.scroll,
                  ),
                )
              ],
            ),
          ),
        ),
      ),
   );
}

class Model {
  const Model(this.country, this.density);

  final String country;
  final double density;
}
NOTE
- Refer to
iconSize, for setting the size of the icon.
Legend toggling
NOTE
Legend toggling is not applicable for bar type legend.
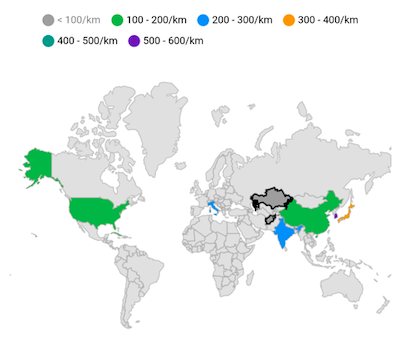
You can enable toggling the legend items and the corresponding shapes or bubbles using the enableToggleInteraction argument in the constructor. The default value of the enableToggleInteraction argument in the constructor is false. You can customize the toggled shapes or bubbles using the following properties:
-
Toggled item color - Change the color for the toggled legend item’s icon and it’s shape or bubble using the
toggledItemColorargument in theconstructor. -
Toggled item stroke color - Change the stroke color which applies to the toggled legend item’s shape or bubble using the
toggledItemStrokeColorargument in theconstructor. -
Toggled item stroke width - Change the stroke width which applies to the toggled legend item’s shape or bubble using the
toggledItemStrokeWidthargument in theconstructor. -
Toggled item opacity - Change the opacity of the toggled legend item’s shape or bubble using the
toggledItemOpacityargument in theconstructor.
late List<Model> _data;
late MapShapeSource _shapeSource;

@override
void initState() {
   super.initState();
   _data = <Model>[
      Model('India', 280),
      Model('United States of America', 190),
      Model('Kazakhstan', 37),
      Model('Italy', 201),
      Model('Korea', 512),
      Model('Japan', 335),
      Model('Cuba', 103),
      Model('China', 148)
   ];

   _shapeSource = MapShapeSource.asset("assets/world_map.json",
        shapeDataField: "name",
        dataCount: _data.length,
        primaryValueMapper: (int index) => _data[index].country,
        shapeColorValueMapper: (int index) => _data[index].density,
        shapeColorMappers: [
          MapColorMapper(from: 0, to: 100, color: Colors.red, text: '< 100/km'),
          MapColorMapper(
              from: 101, to: 200, color: Colors.green, text: '100 - 200/km'),
          MapColorMapper(
              from: 201, to: 300, color: Colors.blue, text: '200 - 300/km'),
          MapColorMapper(
              from: 301, to: 400, color: Colors.orange, text: '300 - 400/km'),
          MapColorMapper(
              from: 401, to: 500, color: Colors.teal, text: '400 - 500/km'),
          MapColorMapper(
              from: 501,
              to: 600,
              color: Colors.deepPurple,
              text: '500 - 600/km'),
    ]);
}

@override
Widget build(BuildContext context) {
    return Scaffold(
      body: Center(
        child: Container(
          height: 350,
          child: Padding(
            padding: const EdgeInsets.only(left: 15, right: 15),
            child: SfMaps(
              layers: [
                MapShapeLayer(
                  source: _shapeSource,
                  legend: MapLegend(
                    MapElement.shape,
                    enableToggleInteraction: true,
                    toggledItemColor: Colors.grey,
                    toggledItemStrokeWidth: 3,
                    toggledItemStrokeColor: Colors.black,
                  ),
                )
              ],
            ),
          ),
        ),
      ),
   );
}

class Model {
  const Model(this.country, this.density);

  final String country;
  final double density;
}
Using SfMapsTheme
You can also customize the below appearance of the legend using SfMapsTheme.
-
Toggled item color - Change the color for the toggled legend item’s icon and it’s shape or bubble using the
SfMapsThemeData.toggledItemColorproperty. -
Toggled item stroke color - Change the stroke color which applies to the toggled legend item’s shape or bubble using the
SfMapsThemeData.toggledItemStrokeColorproperty. -
Toggled item stroke width - Change the stroke width which applies to the toggled legend item’s shape or bubble using the
SfMapsThemeData.toggledItemStrokeWidthproperty.
NOTE
You must import the
theme.dartlibrary from theCorepackage to useSfMapsTheme.
late List<Model> _data;
late MapShapeSource _shapeSource;

@override
void initState() {
    super.initState();
    _data = <Model>[
      Model('India', 280),
      Model('United States of America', 190),
      Model('Kazakhstan', 37),
      Model('Italy', 201),
      Model('Korea', 512),
      Model('Japan', 335),
      Model('Cuba', 103),
      Model('China', 148)
   ];

   _shapeSource = MapShapeSource.asset("assets/world_map.json",
        shapeDataField: "name",
        dataCount: _data.length,
        primaryValueMapper: (int index) => _data[index].country,
        shapeColorValueMapper: (int index) => _data[index].density,
        shapeColorMappers: [
          MapColorMapper(from: 0, to: 100, color: Colors.red, text: '< 100/km'),
          MapColorMapper(
              from: 101, to: 200, color: Colors.green, text: '100 - 200/km'),
          MapColorMapper(
              from: 201, to: 300, color: Colors.blue, text: '200 - 300/km'),
          MapColorMapper(
              from: 301, to: 400, color: Colors.orange, text: '300 - 400/km'),
          MapColorMapper(
              from: 401, to: 500, color: Colors.teal, text: '400 - 500/km'),
          MapColorMapper(
              from: 501,
              to: 600,
              color: Colors.deepPurple,
              text: '500 - 600/km'),
    ]);
}

@override
Widget build(BuildContext context) {
    return Scaffold(
      body: Center(
        child: Container(
          height: 350,
          child: Padding(
            padding: const EdgeInsets.only(left: 15, right: 15),
            child: SfMapsTheme(
              data: SfMapsThemeData(
                toggledItemColor: Colors.grey,
                toggledItemStrokeWidth: 3,
                toggledItemStrokeColor: Colors.black,
              ),
              child: SfMaps(
                layers: [
                  MapShapeLayer(
                    source: _shapeSource,
                    legend: MapLegend(
                      MapElement.shape,
                      enableToggleInteraction: true,
                    ),
                  )
                ],
              ),
            ),
          ),
        ),
      ),
   );
}

class Model {
   Model(this.country, this.density);

   final String country;
   final double density;
}
Text style
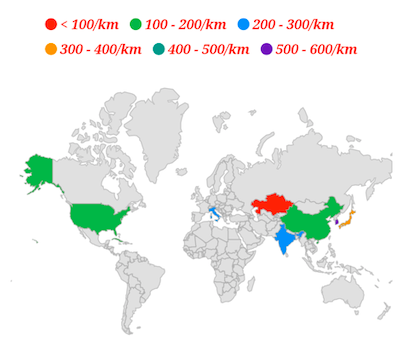
You can customize the legend item’s text style using the MapLegend.textStyle property.
late List<Model> _data;
late MapShapeSource _shapeSource;

@override
void initState() {
    super.initState();
    _data = <Model>[
      Model('India', 280),
      Model('United States of America', 190),
      Model('Kazakhstan', 37),
      Model('Italy', 201),
      Model('Korea', 512),
      Model('Japan', 335),
      Model('Cuba', 103),
      Model('China', 148)
   ];

   _shapeSource = MapShapeSource.asset("assets/world_map.json",
        shapeDataField: "name",
        dataCount: _data.length,
        primaryValueMapper: (int index) => _data[index].country,
        shapeColorValueMapper: (int index) => _data[index].density,
        shapeColorMappers: [
          MapColorMapper(from: 0, to: 100, color: Colors.red, text: '< 100/km'),
          MapColorMapper(
              from: 101, to: 200, color: Colors.green, text: '100 - 200/km'),
          MapColorMapper(
              from: 201, to: 300, color: Colors.blue, text: '200 - 300/km'),
          MapColorMapper(
              from: 301, to: 400, color: Colors.orange, text: '300 - 400/km'),
          MapColorMapper(
              from: 401, to: 500, color: Colors.teal, text: '400 - 500/km'),
          MapColorMapper(
              from: 501,
              to: 600,
              color: Colors.deepPurple,
              text: '500 - 600/km'),
        ]);
}

@override
Widget build(BuildContext context) {
    return Scaffold(
      body: Center(
        child: Container(
          height: 350,
          child: Padding(
            padding: const EdgeInsets.only(left: 15, right: 15),
            child: SfMaps(
              layers: [
                MapShapeLayer(
                  source: _shapeSource,
                  legend: MapLegend(
                    MapElement.shape,
                    textStyle: const TextStyle(
                        color: Colors.red,
                        fontSize: 16,
                        fontWeight: FontWeight.bold,
                        fontStyle: FontStyle.italic,
                        fontFamily: 'Times'
                    ),
                  ),
                )
              ],
            ),
          ),
        ),
      ),
   );
}

class Model {
  Model(this.country, this.density);

  final String country;
  final double density;
}
Using SfMapsTheme
You can also customize the legend item’s text style using the SfMapsThemeData.legendTextStyle property in SfMapsTheme.
NOTE
You must import the
theme.dartlibrary from theCorepackage to useSfMapsTheme.
late List<Model> _data;
late MapShapeSource _shapeSource;

@override
void initState() {
    super.initState();
    _data = <Model>[
      Model('India', 280),
      Model('United States of America', 190),
      Model('Kazakhstan', 37),
      Model('Italy', 201),
      Model('Korea', 512),
      Model('Japan', 335),
      Model('Cuba', 103),
      Model('China', 148)
   ];

   _shapeSource = MapShapeSource.asset("assets/world_map.json",
        shapeDataField: "name",
        dataCount: _data.length,
        primaryValueMapper: (int index) => _data[index].country,
        shapeColorValueMapper: (int index) => _data[index].density,
        shapeColorMappers: [
          MapColorMapper(from: 0, to: 100, color: Colors.red, text: '< 100/km'),
          MapColorMapper(
              from: 101, to: 200, color: Colors.green, text: '100 - 200/km'),
          MapColorMapper(
              from: 201, to: 300, color: Colors.blue, text: '200 - 300/km'),
          MapColorMapper(
              from: 301, to: 400, color: Colors.orange, text: '300 - 400/km'),
          MapColorMapper(
              from: 401, to: 500, color: Colors.teal, text: '400 - 500/km'),
          MapColorMapper(
              from: 501,
              to: 600,
              color: Colors.deepPurple,
              text: '500 - 600/km'),
        ]);
}

@override
Widget build(BuildContext context) {
    return Scaffold(
      body: Center(
        child: Container(
          height: 350,
          child: Padding(
            padding: const EdgeInsets.only(left: 15, right: 15),
            child: SfMapsTheme(
              data: SfMapsThemeData(
                legendTextStyle: TextStyle(
                    color: Colors.red,
                    fontSize: 16,
                    fontWeight: FontWeight.bold,
                    fontStyle: FontStyle.italic,
                    fontFamily: 'Times'
                ),
              ),
              child: SfMaps(
                layers: [
                  MapShapeLayer(
                    source: _shapeSource,
                    legend: MapLegend(MapElement.shape),
                  )
                ],
              ),
            ),
          ),
        ),
      ),
    );
  }
}

class Model {
  const Model(this.country, this.density);

  final String country;
  final double density;
}
Default legend appearance customization
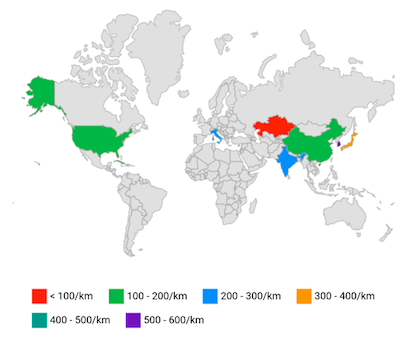
You can customize the legend items using the following properties.
-
iconType - Used to change the icon shape. The default value of the
iconTypeargument in theconstructorisMapIconType.circle. The possible values arecircle,rectangle,triangle, anddiamond. -
iconSize - Used to change the size of the icon. The default value of
iconSizeargument in theconstructorisSize(12.0, 12.0). -
spacing - Used to provide space between the each legend items. The default value of the
spacingargument in theconstructoris10.0. -
direction - Used to arrange the legend items in either horizontal or vertical direction. The default value of
directionproperty ishorizontal, if the value of thepositionproperty istop,bottomand defaults tovertical, if the value of thepositionproperty isleftorright. -
padding - Used to set padding around the legend. The default value of the
paddingproperty isEdgeInsets.all(10.0).
late List<Model> _data;
late MapShapeSource _shapeSource;

@override
void initState() {
    super.initState();
    _data = <Model>[
      Model('India', 280),
      Model('United States of America', 190),
      Model('Kazakhstan', 37),
      Model('Italy', 201),
      Model('Korea', 512),
      Model('Japan', 335),
      Model('Cuba', 103),
      Model('China', 148)
    ];

    _shapeSource = MapShapeSource.asset("assets/world_map.json",
        shapeDataField: "name",
        dataCount: _data.length,
        primaryValueMapper: (int index) => _data[index].country,
        shapeColorValueMapper: (int index) => _data[index].density,
        shapeColorMappers: [
          MapColorMapper(from: 0, to: 100, color: Colors.red, text: '< 100/km'),
          MapColorMapper(
              from: 101, to: 200, color: Colors.green, text: '100 - 200/km'),
          MapColorMapper(
              from: 201, to: 300, color: Colors.blue, text: '200 - 300/km'),
          MapColorMapper(
              from: 301, to: 400, color: Colors.orange, text: '300 - 400/km'),
          MapColorMapper(
              from: 401, to: 500, color: Colors.teal, text: '400 - 500/km'),
          MapColorMapper(
              from: 501,
              to: 600,
              color: Colors.deepPurple,
              text: '500 - 600/km'),
        ]);
}

@override
Widget build(BuildContext context) {
    return Scaffold(
      body: Center(
        child: Container(
          height: 350,
          child: Padding(
            padding: const EdgeInsets.only(left: 15, right: 15),
            child: SfMaps(
              layers: [
                MapShapeLayer(
                  source: _shapeSource,
                  legend: MapLegend(
                    MapElement.shape,
                    position: MapLegendPosition.bottom,
                    overflowMode: MapLegendOverflowMode.wrap,
                    iconType: MapIconType.square,
                    iconSize: Size(15.0, 15.0),
                    itemsSpacing: 15,
                  ),
                )
              ],
            ),
          ),
        ),
      ),
   );
}

class Model {
  const Model(this.country, this.density);

  final String country;
  final double density;
}
NOTE
- Refer to
position, for setting the position of the legend.
Bar legend segment painting style
Solid
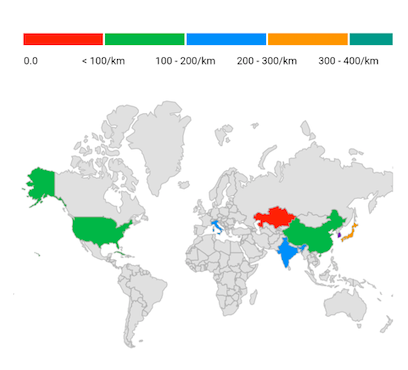
You can set solid color for the bar by using the MapLegendPaintingStyle.solid. By defaults MapLegendPaintingStyle will be solid.
late List<Model> _data;
late MapShapeSource _shapeSource;

@override
void initState() {
   super.initState();
   _data = <Model>[
      Model('India', 280),
      Model('United States of America', 190),
      Model('Kazakhstan', 37),
      Model('Italy', 201),
      Model('Korea', 512),
      Model('Japan', 335),
      Model('Cuba', 103),
      Model('China', 148)
   ];

   _shapeSource = MapShapeSource.asset("assets/world_map.json",
        shapeDataField: "name",
        dataCount: _data.length,
        primaryValueMapper: (int index) => _data[index].country,
        shapeColorValueMapper: (int index) => _data[index].density,
        shapeColorMappers: [
          MapColorMapper(from: 0, to: 100, color: Colors.red, text: '< 100/km'),
          MapColorMapper(
              from: 101, to: 200, color: Colors.green, text: '100 - 200/km'),
          MapColorMapper(
              from: 201, to: 300, color: Colors.blue, text: '200 - 300/km'),
          MapColorMapper(
              from: 301, to: 400, color: Colors.orange, text: '300 - 400/km'),
          MapColorMapper(
              from: 401, to: 500, color: Colors.teal, text: '400 - 500/km'),
          MapColorMapper(
              from: 501,
              to: 600,
              color: Colors.deepPurple,
              text: '500 - 600/km'),
        ]);
}

@override
Widget build(BuildContext context) {
    return Scaffold(
      body: Center(
        child: Container(
          height: 350,
          child: Padding(
            padding: EdgeInsets.only(left: 15, right: 15),
            child: SfMaps(
              layers: [
                MapShapeLayer(
                  source: _shapeSource,
                  legend: MapLegend.bar(
                    MapElement.shape,
                    segmentPaintingStyle: MapLegendPaintingStyle.solid,
                  ),
                )
              ],
            ),
          ),
        ),
      ),
   );
}

class Model {
  const Model(this.country, this.density);

  final String country;
  final double density;
}
Gradient
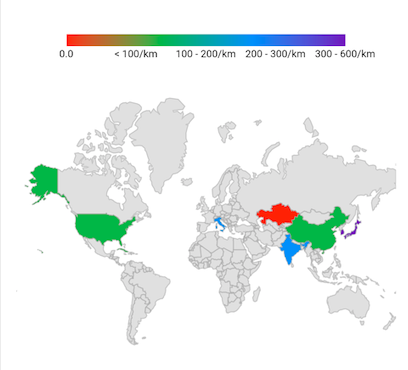
You can set gradient color for the bar by using the MapLegendPaintingStyle.gradient.
late List<Model> _data;
late MapShapeSource _shapeSource;

@override
void initState() {
   super.initState();
   _data = <Model>[
      Model('India', 280),
      Model('United States of America', 190),
      Model('Kazakhstan', 37),
      Model('Italy', 201),
      Model('Korea', 512),
      Model('Japan', 335),
      Model('Cuba', 103),
      Model('China', 148)
   ];

    _shapeSource = MapShapeSource.asset("assets/world_map.json",
           shapeDataField: "name",
           dataCount: _data.length,
           primaryValueMapper: (int index) => _data[index].country,
           shapeColorValueMapper: (int index) => _data[index].density,
           shapeColorMappers: [
             MapColorMapper(from: 0, to: 100, color: Colors.red, text: '< 100/km'),
             MapColorMapper(
                 from: 101, to: 200, color: Colors.green, text: '100 - 200/km'),
             MapColorMapper(
                 from: 201, to: 300, color: Colors.blue, text: '200 - 300/km'),
             MapColorMapper(
                 from: 301,
                 to: 600,
                 color: Colors.deepPurple,
                 text: '300 - 600/km'),
    ]);
}

@override
Widget build(BuildContext context) {
    return Scaffold(
      body: Center(
        child: Container(
          height: 350,
          child: Padding(
            padding: EdgeInsets.only(left: 15, right: 15),
            child: SfMaps(
              layers: [
                MapShapeLayer(
                  source: _shapeSource,
                  legend: MapLegend.bar(
                    MapElement.shape,
                    labelsPlacement: MapLegendLabelsPlacement.betweenItems,
                    edgeLabelsPlacement: MapLegendEdgeLabelsPlacement.center,
                    segmentPaintingStyle: MapLegendPaintingStyle.gradient,
                  ),
                )
              ],
            ),
          ),
        ),
      ),
   );
}

class Model {
  const Model(this.country, this.density);

  final String country;
  final double density;
}
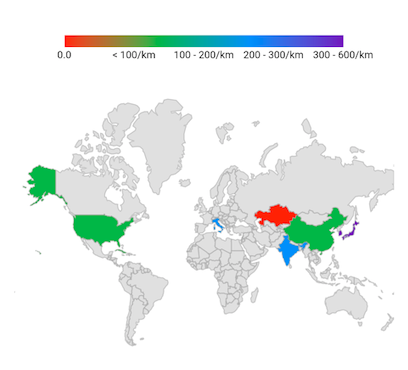
Bar legend appearance customization
You can customize the legend items using the following properties.
-
segmentSize - Used to change the size of individual bar segments. When gradient paint style is applied,
segmentSizeargument in theconstructorwill update the whole bar. -
labelOverflow - Used to remove or trim the legend labels based on the bar legend size.The default value of the
labelOverflowargument in theconstructorwill beMapLabelOverflow.hide. -
edgeLabelsPlacement - Used to place the edge labels either inside or outside of the bar legend. The default value of the
edgeLabelsPlacementargument in theconstructorwill beMapLegendEdgeLabelsPlacement.inside. -
spacing - Used to provide space between the each legend items. The default value of the
spacingis2.0. This is not applicable for gradient legend. -
direction - Used to arrange the legend items in either horizontal or vertical direction. The default value of
directionproperty ishorizontal, if the value of thepositionproperty istop,bottomand defaults tovertical, if the value of thepositionproperty isleftorright. -
padding - Used to set padding around the legend. The default value of the
paddingproperty isEdgeInsets.all(10.0).
late List<Model> _data;
late MapShapeSource _shapeSource;

@override
void initState() {
   super.initState();
   _data = <Model>[
      Model('India', 280),
      Model('United States of America', 190),
      Model('Kazakhstan', 37),
      Model('Italy', 201),
      Model('Korea', 512),
      Model('Japan', 335),
      Model('Cuba', 103),
      Model('China', 148)
   ];

    _shapeSource = MapShapeSource.asset("assets/world_map.json",
           shapeDataField: "name",
           dataCount: _data.length,
           primaryValueMapper: (int index) => _data[index].country,
           shapeColorValueMapper: (int index) => _data[index].density,
           shapeColorMappers: [
             MapColorMapper(from: 0, to: 100, color: Colors.red, text: '< 100/km'),
             MapColorMapper(
                 from: 101, to: 200, color: Colors.green, text: '100 - 200/km'),
             MapColorMapper(
                 from: 201, to: 300, color: Colors.blue, text: '200 - 300/km'),
             MapColorMapper(
                 from: 301,
                 to: 600,
                 color: Colors.deepPurple,
                 text: '300 - 600/km'),
    ]);
}

@override
Widget build(BuildContext context) {
    return Scaffold(
      body: Center(
        child: Container(
          height: 350,
          child: Padding(
            padding: EdgeInsets.only(left: 15, right: 15),
            child: SfMaps(
              layers: [
                MapShapeLayer(
                  source: _shapeSource,
                  legend: MapLegend.bar(
                    MapElement.shape,
                    labelsPlacement: MapLegendLabelsPlacement.betweenItems,
                    edgeLabelsPlacement: MapLegendEdgeLabelsPlacement.center,
                    segmentPaintingStyle: MapLegendPaintingStyle.gradient,
                    labelOverflow: MapLabelOverflow.ellipsis,
                  ),
                )
              ],
            ),
          ),
        ),
      ),
   );
}

class Model {
  const Model(this.country, this.density);

  final String country;
  final double density;
}
Bar legend labels placement
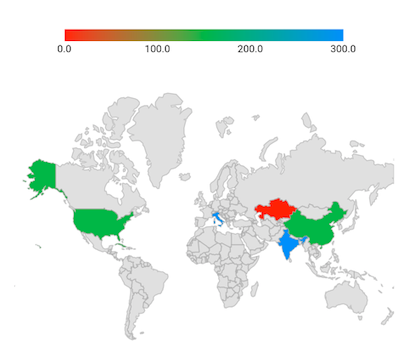
You can place the labels either between the segments or on the segments using the labelsPlacement property.
Labels placement for range color mapper
The labels are positioned between the segments when setting range color mapper without setting color mapper MapColorMapper.text property. The MapColorMapper.from value of the first item is positioned at starting point of the first segment and the MapColorMapper.to value of the first item is placed at the first segment end position. For other segments, the values of MapColorMapper.to is positioned as label between the other segments.
late List<Model> _data;
late MapShapeSource _shapeSource;

@override
void initState() {
  super.initState();
  _data = <Model>[
    Model('India', 280),
    Model('United States of America', 190),
    Model('Kazakhstan', 37),
    Model('Italy', 201),
    Model('Cuba', 103),
    Model('China', 148),
];

_shapeSource = MapShapeSource.asset("assets/world_map.json",
    shapeDataField: "name",
    dataCount: _data.length,
    primaryValueMapper: (int index) => _data[index].country,
    shapeColorValueMapper: (int index) => _data[index].density,
    shapeColorMappers: [
      MapColorMapper(from: 0, to: 100, color: Colors.red),
      MapColorMapper(
              from: 101, to: 200, color: Colors.green),
      MapColorMapper(
              from: 201, to: 300, color: Colors.blue),
    ]
  );
}

@override
Widget build(BuildContext context) {
  return Scaffold(
      body: Center(
        child: Container(
          height: 350,
          child: Padding(
            padding: EdgeInsets.only(left: 15, right: 15),
            child: SfMaps(
              layers: [
                MapShapeLayer(
                  source: _shapeSource,
                  legend: MapLegend.bar(
                    MapElement.shape,
                    labelsPlacement: MapLegendLabelsPlacement.betweenItems,
                    segmentPaintingStyle: MapLegendPaintingStyle.gradient,
                  ),
                )
              ],
            ),
          ),
        ),
     ),
  );
}

class Model {
  const Model(this.country, this.density);

  final String country;
  final double density;
}
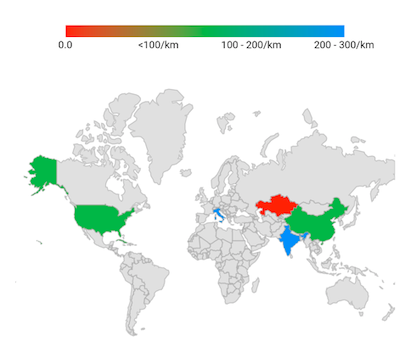
The labels are positioned between the segments when setting range color mapper along with setting color mapper MapColorMapper.text property. The MapColorMapper.from value of the first item is positioned at starting point of the first segment and the MapColorMapper.text value of the first item is placed at the first segment end position. For Other segments, the value of MapColorMapper.text is positioned as label between the segments.
late List<Model> _data;
late MapShapeSource _shapeSource;

@override
void initState() {
  super.initState();
  _data = <Model>[
    Model('India', 280),
    Model('United States of America', 190),
    Model('Kazakhstan', 37),
    Model('Italy', 201),
    Model('Cuba', 103),
    Model('China', 148),
  ];

  _shapeSource = MapShapeSource.asset("assets/world_map.json",
    shapeDataField: "name",
    dataCount: _data.length,
    primaryValueMapper: (int index) => _data[index].country,
    shapeColorValueMapper: (int index) => _data[index].density,
    shapeColorMappers: [
        MapColorMapper(from: 0, to: 100, color: Colors.red, text: '<100/km'),
        MapColorMapper(from: 101, to: 200, color: Colors.green, text: '100 - 200/km'),
        MapColorMapper(from: 201, to: 300, color: Colors.blue, text: '200 - 300/km'),
    ]
  );
}

@override
Widget build(BuildContext context) {
  return Scaffold(
      body: Center(
        child: Container(
          height: 350,
          child: Padding(
            padding: EdgeInsets.only(left: 15, right: 15),
            child: SfMaps(
              layers: [
                MapShapeLayer(
                  source: _shapeSource,
                  legend: MapLegend.bar(
                    MapElement.shape,
                    labelsPlacement: MapLegendLabelsPlacement.betweenItems,
                    segmentPaintingStyle: MapLegendPaintingStyle.gradient,
                  ),
                )
              ],
            ),
          ),
        ),
     ),
  );
}

class Model {
  const Model(this.country, this.density);

  final String country;
  final double density;
}
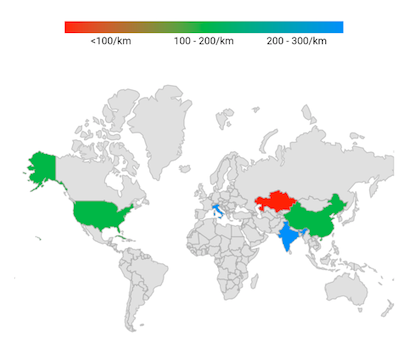
The labels are positioned at the center of the segments when setting the labelsPlacement property to MapLegendLabelsPlacement.onItem. The labels calculated based on the value of MapColorMapper.text property. If the value of MapColorMapper.text property is null, labels calculated based on the values of MapColorMapper.from and MapColorMapper.to properties.
late List<Model> _data;
late MapShapeSource _shapeSource;

@override
void initState() {
  super.initState();
  _data = <Model>[
    Model('India', 280),
    Model('United States of America', 190),
    Model('Kazakhstan', 37),
    Model('Italy', 201),
    Model('Cuba', 103),
    Model('China', 148),
];

_shapeSource = MapShapeSource.asset("assets/world_map.json",
    shapeDataField: "name",
    dataCount: _data.length,
    primaryValueMapper: (int index) => _data[index].country,
    shapeColorValueMapper: (int index) => _data[index].density,
    shapeColorMappers: [
        MapColorMapper(from: 0, to: 100, color: Colors.red, text: '<100/km'),
        MapColorMapper(from: 101, to: 200, color: Colors.green, text: '100 - 200/km'),
        MapColorMapper(from: 201, to: 300, color: Colors.blue, text: '200 - 300/km'),
    ]
  );
}

@override
Widget build(BuildContext context) {
  return Scaffold(
      body: Center(
        child: Container(
          height: 350,
          child: Padding(
            padding: EdgeInsets.only(left: 15, right: 15),
            child: SfMaps(
              layers: [
                MapShapeLayer(
                  source: _shapeSource,
                  legend: MapLegend.bar(
                    MapElement.shape,
                    labelsPlacement: MapLegendLabelsPlacement.onItem,
                    edgeLabelsPlacement: MapLegendEdgeLabelsPlacement.center,
                    segmentPaintingStyle: MapLegendPaintingStyle.gradient,
                  ),
                )
              ],
            ),
          ),
        ),
     ),
  );
}

class Model {
  const Model(this.country, this.density);

  final String country;
  final double density;
}
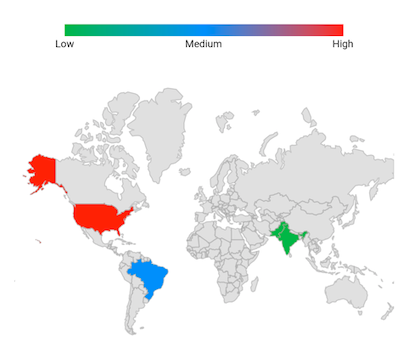
Labels placement for equal color mapper
The labelsPlacement option is not applicable for the shape/bubble applied with equal color mapper. By default, the labels are positioned at center of the segment.
late List<Model> _data;
late MapShapeSource _dataSource;

@override
void initState() {
  _data = <Model>[
    Model('India', "Low"),
    Model('United States of America', "High"),
    Model('Pakistan', "Low"),
    Model('Brazil', "Medium"),
  ];

   _dataSource = MapShapeSource.asset(
     "assets/world_map.json",
     shapeDataField: "name",
     dataCount: _data.length,
     primaryValueMapper: (int index) {
        return _data[index].country;
     },
     shapeColorValueMapper: (int index) {
       return _data[index].storage;
     },
     shapeColorMappers: [
        MapColorMapper(value: "Low", color: Colors.green),
        MapColorMapper(value: "Medium", color: Colors.blue),
        MapColorMapper(value: "High", color: Colors.red),
     ],
  );
  super.initState();
}

@override
Widget build(BuildContext context) {
  return Scaffold(
    body: Center(
       child: Container(
          height: 350,
          child: Padding(
            padding: EdgeInsets.only(left: 15, right: 15),
            child: SfMaps(
              layers: <MapShapeLayer>[
                MapShapeLayer(
                  source: _dataSource,
                  legend: MapLegend.bar(
                    MapElement.shape,
                    edgeLabelsPlacement: MapLegendEdgeLabelsPlacement.center,
                    segmentPaintingStyle: MapLegendPaintingStyle.gradient,
                  ),
                ),
              ],
            ),
          ),
        ),
     ),
  );
}

class Model {
  const Model(this.country, this.storage);

  final String country;
  final String storage;
}
Show pointer
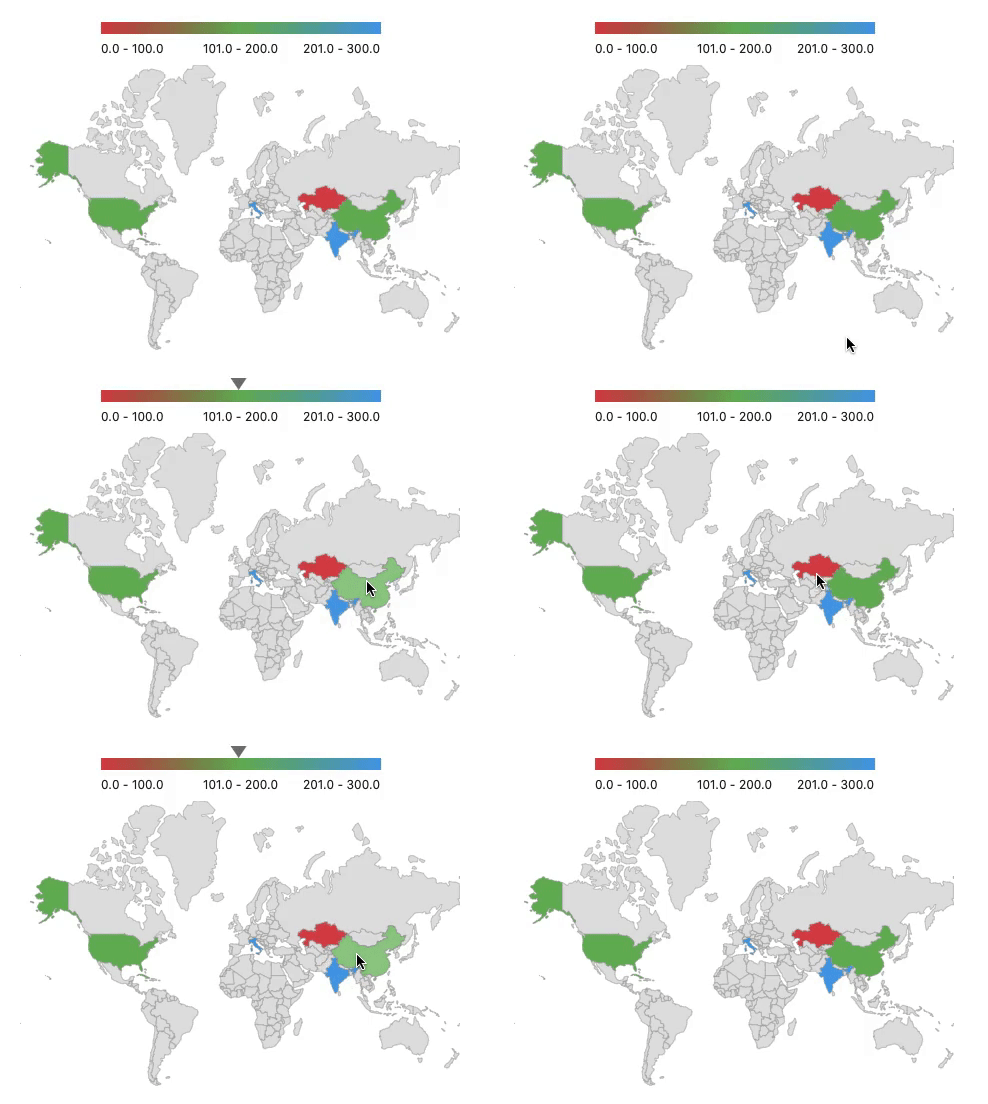
You may show a pointer on the solid or gradient bar legend while hovering over a shape or bubble using the showPointerOnHover property. The default value of the showPointerOnHover property is false.
late List<Model> _data;
late MapShapeSource _shapeSource;

@override
void initState() {
   super.initState();
   _data = <Model>[
      Model('India', 280),
      Model('United States of America', 190),
      Model('Kazakhstan', 37),
      Model('Italy', 201),
      Model('Cuba', 103),
      Model('China', 148),
    ];

    _shapeSource = MapShapeSource.asset(
      "assets/world_map.json",
      shapeDataField: "name",
      dataCount: _data.length,
      primaryValueMapper: (int index) => _data[index].country,
      shapeColorValueMapper: (int index) => _data[index].density,
      shapeColorMappers: [
        MapColorMapper(from: 0, to: 100, color: Colors.red, text: '0 - 100'),
        MapColorMapper(
            from: 101, to: 200, color: Colors.green, text: '101 - 200'),
        MapColorMapper(
            from: 201, to: 300, color: Colors.blue, text: '201 - 300'),
      ],
    );
}

@override
Widget build(BuildContext context) {
  return Scaffold(
     body: Center(
        child: Container(
          height: 350,
          child: Padding(
            padding: EdgeInsets.only(left: 15, right: 15),
            child: SfMaps(
              layers: [
                MapShapeLayer(
                  source: _shapeSource,
                  legend: MapLegend.bar(
                    MapElement.shape,
                    segmentPaintingStyle: MapLegendPaintingStyle.gradient,
                    showPointerOnHover: true,
                  ),
                )
              ],
            ),
          ),
        ),
      ),
   );
}

class Model {
  const Model(this.country, this.density);

  final String country;
  final double density;
}
Pointer builder
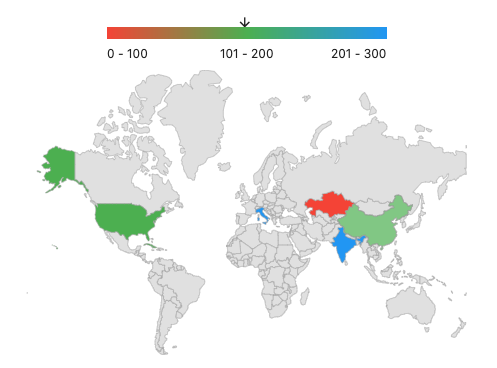
It returns a widget for the given value.
The pointer is used to indicate the exact color of the hovering shape or bubble on the legend segment.
The pointerBuilder will be called when the user interacts with the shapes or bubbles i.e., while tapping in touch devices and hovering in the mouse enabled devices.
late List<Model> _data;
late MapShapeSource _shapeSource;

@override
void initState() {
   super.initState();
   _data = <Model>[
      Model('India', 280),
      Model('United States of America', 190),
      Model('Kazakhstan', 37),
      Model('Italy', 201),
      Model('Cuba', 103),
      Model('China', 148),
   ];

   _shapeSource = MapShapeSource.asset(
      "assets/world_map.json",
      shapeDataField: "name",
      dataCount: _data.length,
      primaryValueMapper: (int index) => _data[index].country,
      shapeColorValueMapper: (int index) => _data[index].density,
      shapeColorMappers: [
        MapColorMapper(from: 0, to: 100, color: Colors.red, text: '0 - 100'),
        MapColorMapper(
            from: 101, to: 200, color: Colors.green, text: '101 - 200'),
        MapColorMapper(
            from: 201, to: 300, color: Colors.blue, text: '201 - 300'),
     ],
   );
}

@override
Widget build(BuildContext context) {
  return Scaffold(
     body: Center(
        child: Container(
          height: 350,
          child: Padding(
            padding: EdgeInsets.only(left: 15, right: 15),
            child: SfMaps(
              layers: [
                MapShapeLayer(
                  source: _shapeSource,
                  legend: MapLegend.bar(
                    MapElement.shape,
                    segmentPaintingStyle: MapLegendPaintingStyle.gradient,
                    showPointerOnHover: true,
                    pointerBuilder: (BuildContext context, dynamic value) {
                      return Icon(Icons.arrow_downward, size: 15);
                    },
                  ),
                )
              ],
            ),
          ),
        ),
      ),
   );
}

class Model {
  const Model(this.country, this.density);

  final String country;
  final double density;
}
Pointer customization
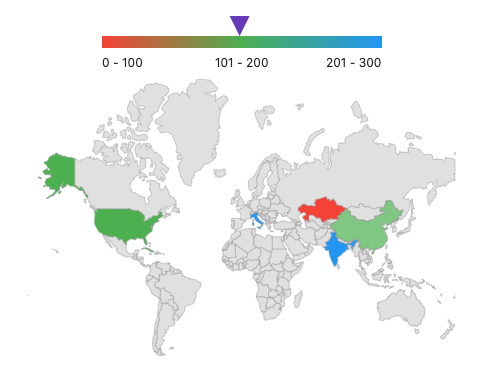
You can customize the size and color of the pointer using the pointerSize and pointerColor properties. The default value of the pointerSize property is Size(16, 12).
late List<Model> _data;
late MapShapeSource _shapeSource;

@override
void initState() {
   super.initState();
   _data = <Model>[
      Model('India', 280),
      Model('United States of America', 190),
      Model('Kazakhstan', 37),
      Model('Italy', 201),
      Model('Cuba', 103),
      Model('China', 148),
    ];

    _shapeSource = MapShapeSource.asset(
      "assets/world_map.json",
      shapeDataField: "name",
      dataCount: _data.length,
      primaryValueMapper: (int index) => _data[index].country,
      shapeColorValueMapper: (int index) => _data[index].density,
      shapeColorMappers: [
        MapColorMapper(from: 0, to: 100, color: Colors.red, text: '0 - 100'),
        MapColorMapper(
            from: 101, to: 200, color: Colors.green, text: '101 - 200'),
        MapColorMapper(
            from: 201, to: 300, color: Colors.blue, text: '201 - 300'),
      ],
   );
}

@override
Widget build(BuildContext context) {
  return Scaffold(
     body: Center(
        child: Container(
          height: 350,
          child: Padding(
            padding: EdgeInsets.only(left: 15, right: 15),
            child: SfMaps(
              layers: [
                MapShapeLayer(
                  source: _shapeSource,
                  legend: MapLegend.bar(
                    MapElement.shape,
                    segmentPaintingStyle: MapLegendPaintingStyle.gradient,
                    showPointerOnHover: true,
                    pointerSize: Size(20, 20),
                    pointerColor: Colors.deepPurple,
                  ),
                )
              ],
            ),
          ),
        ),
      ),
   );
}

class Model {
  const Model(this.country, this.density);

  final String country;
  final double density;
}
NOTE
You can refer to our Flutter Maps feature tour page for its groundbreaking feature representations. You can also explore our Flutter Maps Legend example that shows how to configure a Maps in Flutter.