Flutter Maps (SfMaps) Overview
21 May 20252 minutes to read
Flutter Maps is a powerful data visualization component that displays statistical information for geographical areas. Its rich feature set includes tile rendering from OpenStreetMap, Bing Maps, and other tile providers with marker support, as well as shape layer capabilities such as selection, legends, labels, markers, tooltips, bubbles, color mapping, and much more.
Shape layer
Render GeoJSON data as geographical shapes or any custom shapes on a shape layer for powerful data visualization. Customize the appearance using built-in options to achieve your desired look. For example, you can render a map of the world or any particular country.
Features
-
Data Labels - Provide identification for shapes by displaying their names. Labels can be trimmed or hidden if they exceed shape boundaries.
-
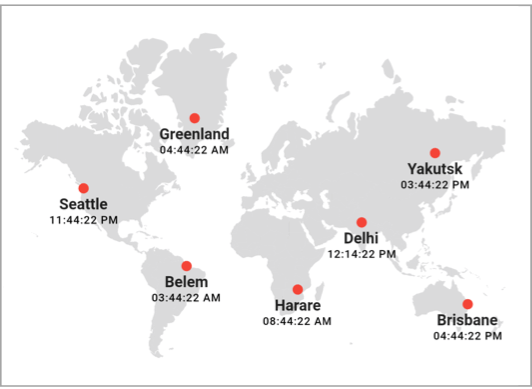
Markers - Denote specific locations using built-in symbols or display custom widgets at particular latitude and longitude coordinates on the map.
-
Bubbles - Add information to shapes such as population density, number of users, and more. Bubbles can be rendered in different colors and sizes based on the data values of their assigned shapes.
-
Shape Selection - Select shapes to highlight specific areas on the map. You can use callbacks to perform custom actions during shape selection.
-
Legend - Provide clear information about the data plotted on the map. The legend toggling feature allows you to visualize only the shapes to which a specific legend applies.
-
Colors - Categorize shapes by customizing their colors based on underlying values. You can set shape colors for specific values or for ranges of values.
-
Tooltip - Display additional information about shapes and bubbles using customizable tooltips.
-
Zooming and Panning - Zoom in for a closer look at specific regions by pinching the map, scrolling the mouse wheel or trackpad, or using the toolbar on web platforms. Pan the map to navigate across regions. You can also customize the initial zoom level and center point.
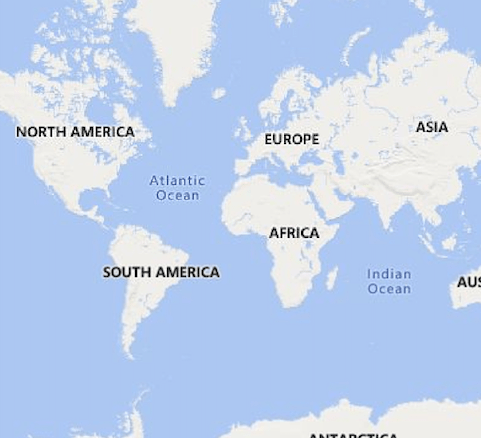
Tile layer
The interactive tile layer allows you to load map tiles from web map tile services such as Bing Maps, OpenStreetMap, Google Maps, TomTom, and others. Use markers to denote specific latitude and longitude coordinates in the tile layer as required. Zoom and pan the tile layer to navigate across regions and take a closer look.
Features
-
Markers - Denote specific locations using built-in symbols or display custom widgets at particular latitude and longitude coordinates on the map.
-
Zooming and Panning - Zoom in for a closer look at specific regions by pinching the map, scrolling the mouse wheel or trackpad, or using the toolbar on web platforms. Pan the map to navigate across regions. You can also customize the initial zoom level and center point.